


Economic Geography Part I
Distribution of key natural resources across India and the World
Source for most of the facts and statistics: Indian Bureau of Mines Reports.
1.3 Iron Ore Distribution Across the World 9
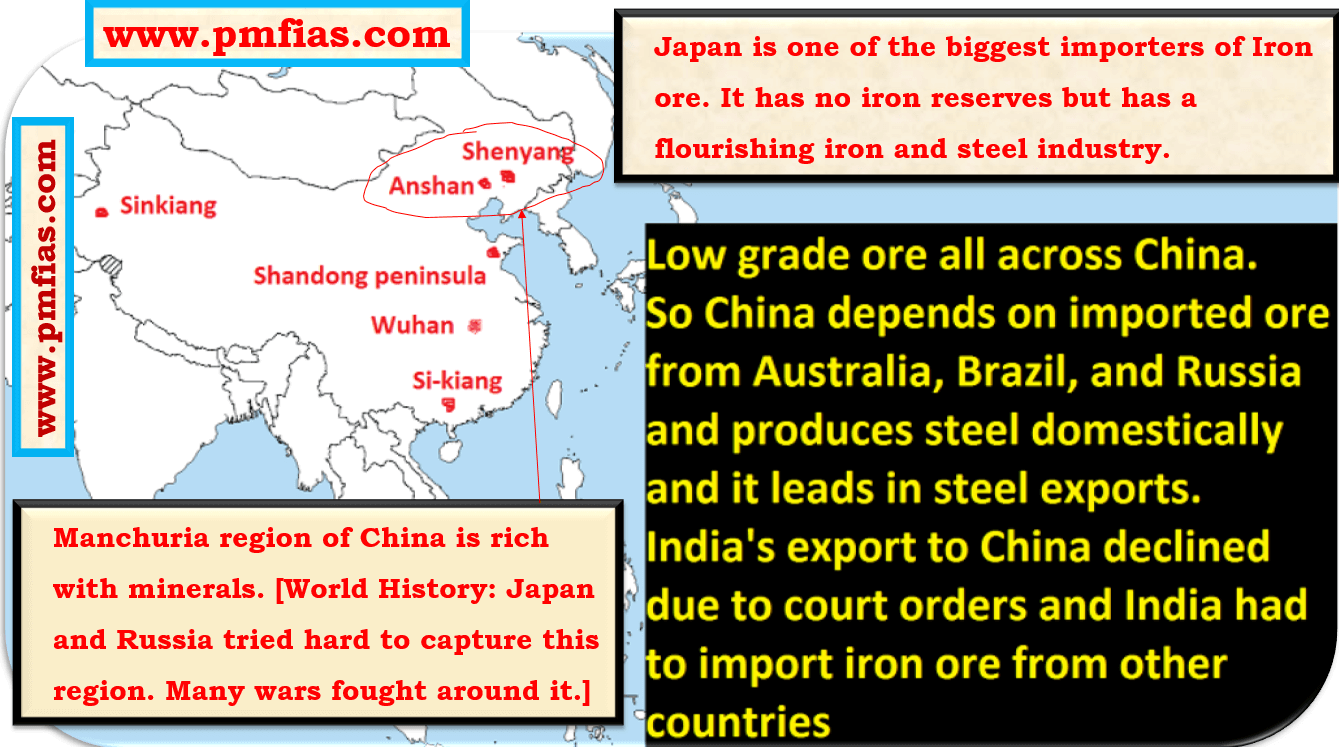
Iron Ore in China: Manchuria, Sinkiang, Si-kiang, Shandog Peninsula 9
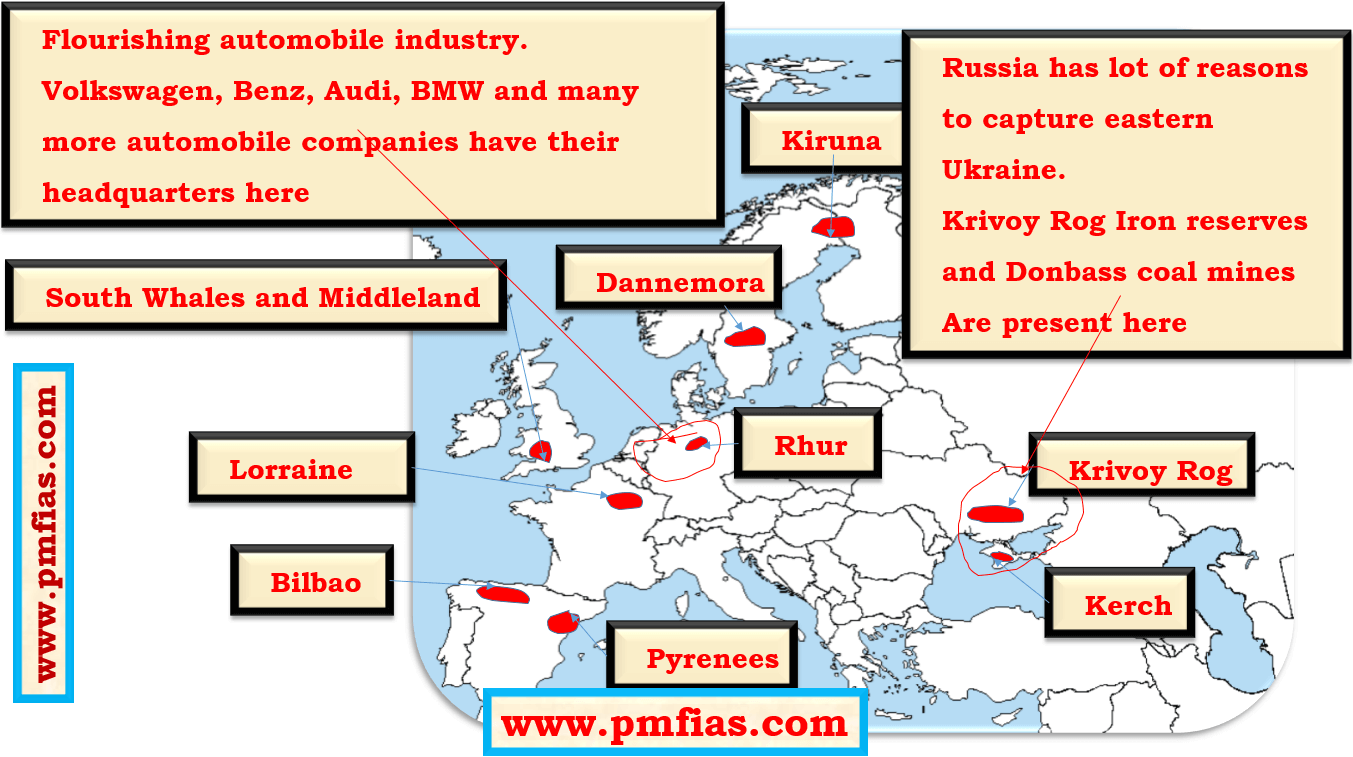
Iron Ore in Europe: Ruhr, South Whales, Krivoy Rog, Bilbao, Lorraine 9
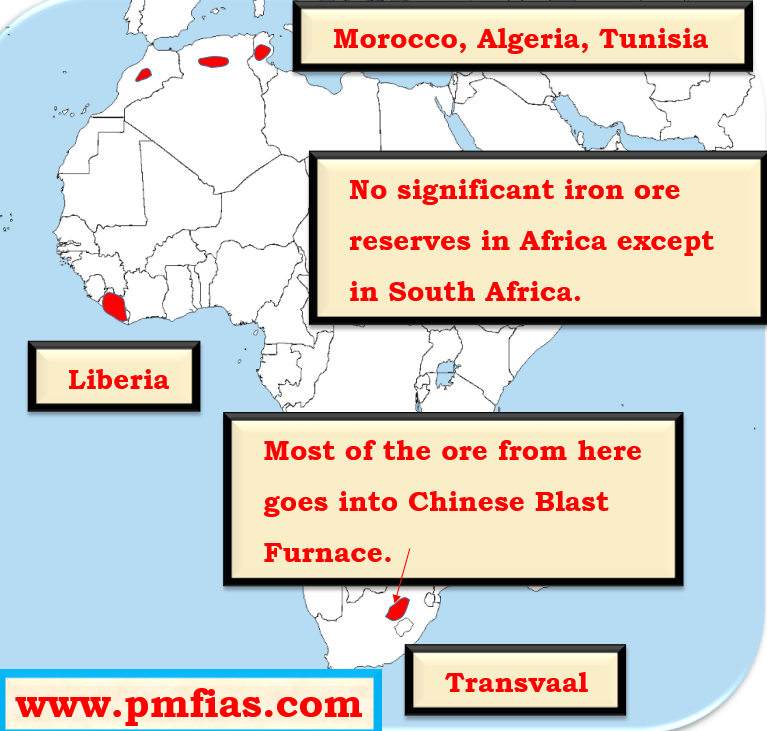
Iron ore in Africa: Transvaal, Liberia 10
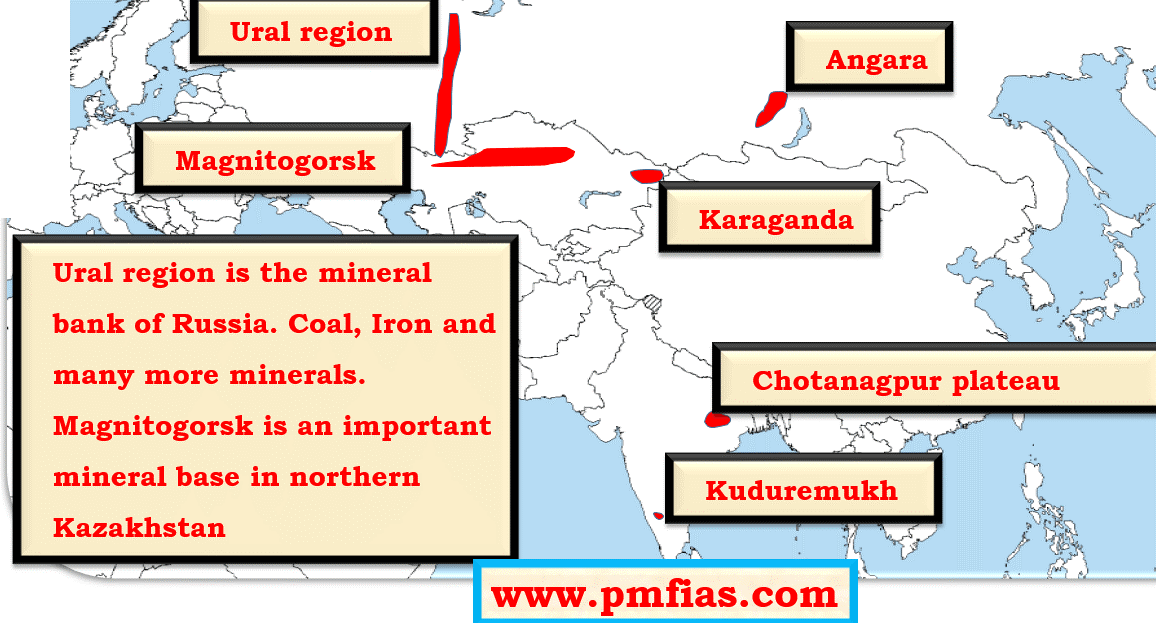
Iron ore in Russia, Kazakhstan: Ural region, Magnitogorsk 11
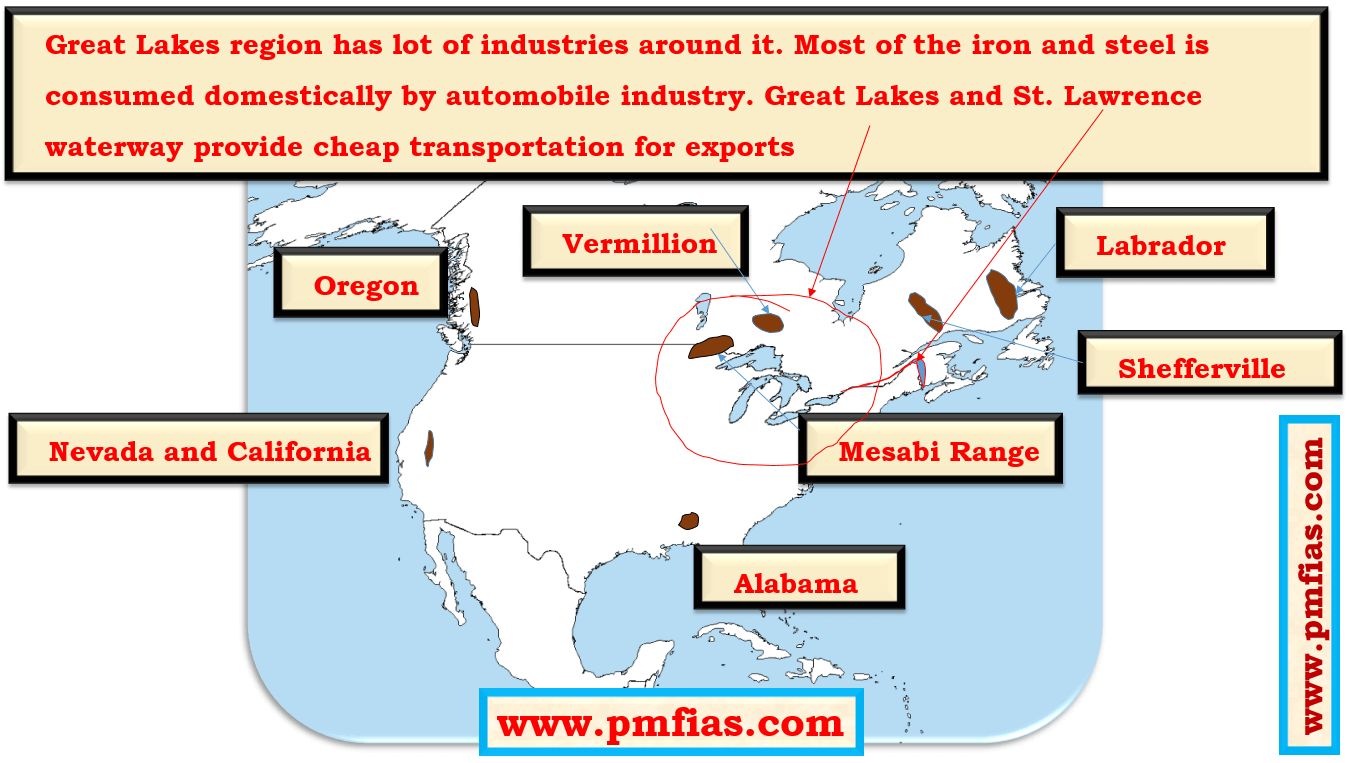
Iron Ore in North America: Great Lakes (Mesabi Region), Labrador 12
Iron Ore in South America: Carajas, Itabira, Minas Geriais 12
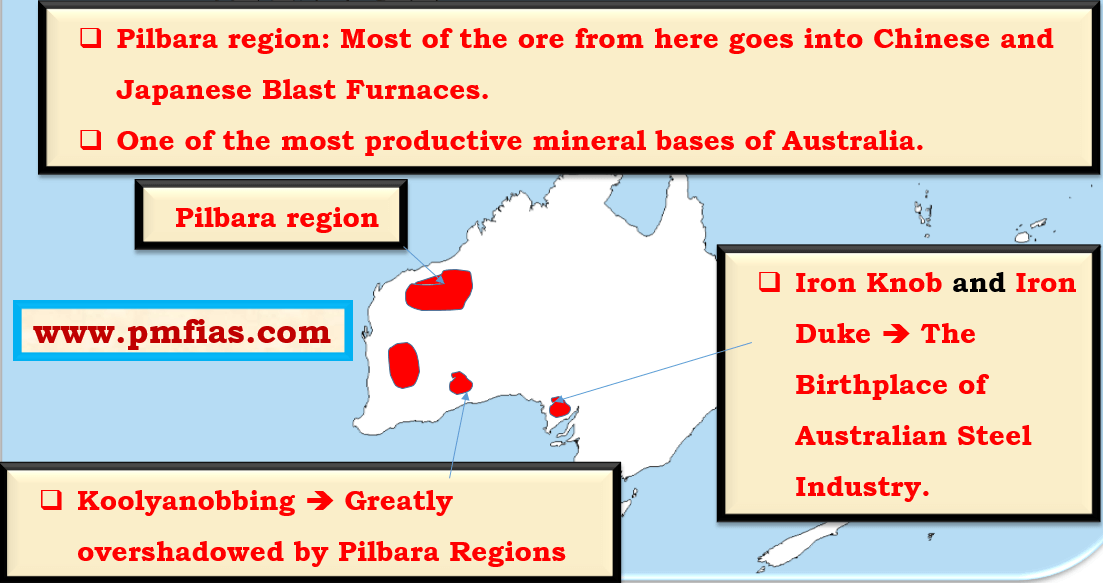
Iron Ore in Australia: Pilbara Region, Koolyanobbing, Iron Duke, Iron Knob 13
Top Iron ore producers in the world 14
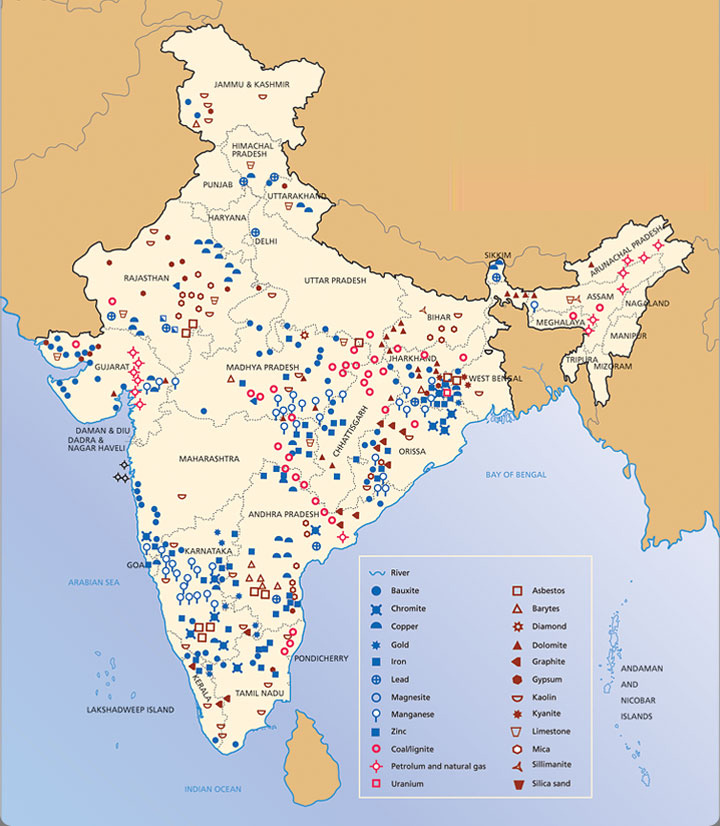
1.4 Iron Ore Distribution in India 14
Iron Ore Production in India 17
Bituminous Coal (black coal) 22
Anthracite Coal (Semi-metallic lustre) 23
Coking Coal vs. Non-Coking Coal (Thermal Coal) 23
2.3 Distribution of Coal in India 24
Gondwana Coal (formed 250 million years ago) 24
Tertiary Coal (formed 60 – 15 million years ago) 26
State-wise coal reserves and coal production in India 28
The demand of coal, production, supply and import of coal in India 29
Why does India import coal although it has enough reserves? 29
Measures taken by the government to boost production 30
2.4 Distribution of Coal across the World 30
Top coal producers and consumers in the world 32
3. Petroleum and Mineral Oil 33
3.1 Formation of Petroleum and Mineral Oil 33
Conditions for Formation of Petroleum and Mineral Oil 34
3.2 Distribution of Petroleum and Mineral Oil in India 35
Extent of Oil Bearing Strata in India 36
On-shore Oil Production in India 38
Off-Shore Oil Production in India 38
State-wise crude oil and natural gas production trends 39
Share of major fuels in Power Generation in India 39
3.3 World distribution of Petroleum and Mineral Oil 46
Countries with The Largest Proven Oil Reserves 47
World’s Top Producers, Consumers and Exporters of Oil 49
OPEC – Organization of Petroleum Exporting Countries 49
4.2 Distribution of Natural Gas across Indian and the World 51
Top natural gas producers, consumers, and countries with highest reserves 51
4.3 Petroleum and Gas Value Chain 53
5. Unconventional Gas Reservoirs 55
Shale Gas Reserves across India and the World 60
Shale Gas Extraction Issues in India – If US can then why can’t India? 62
6.1 Bauxite Distribution in India 64
6.2 Bauxite Distribution across the World 67
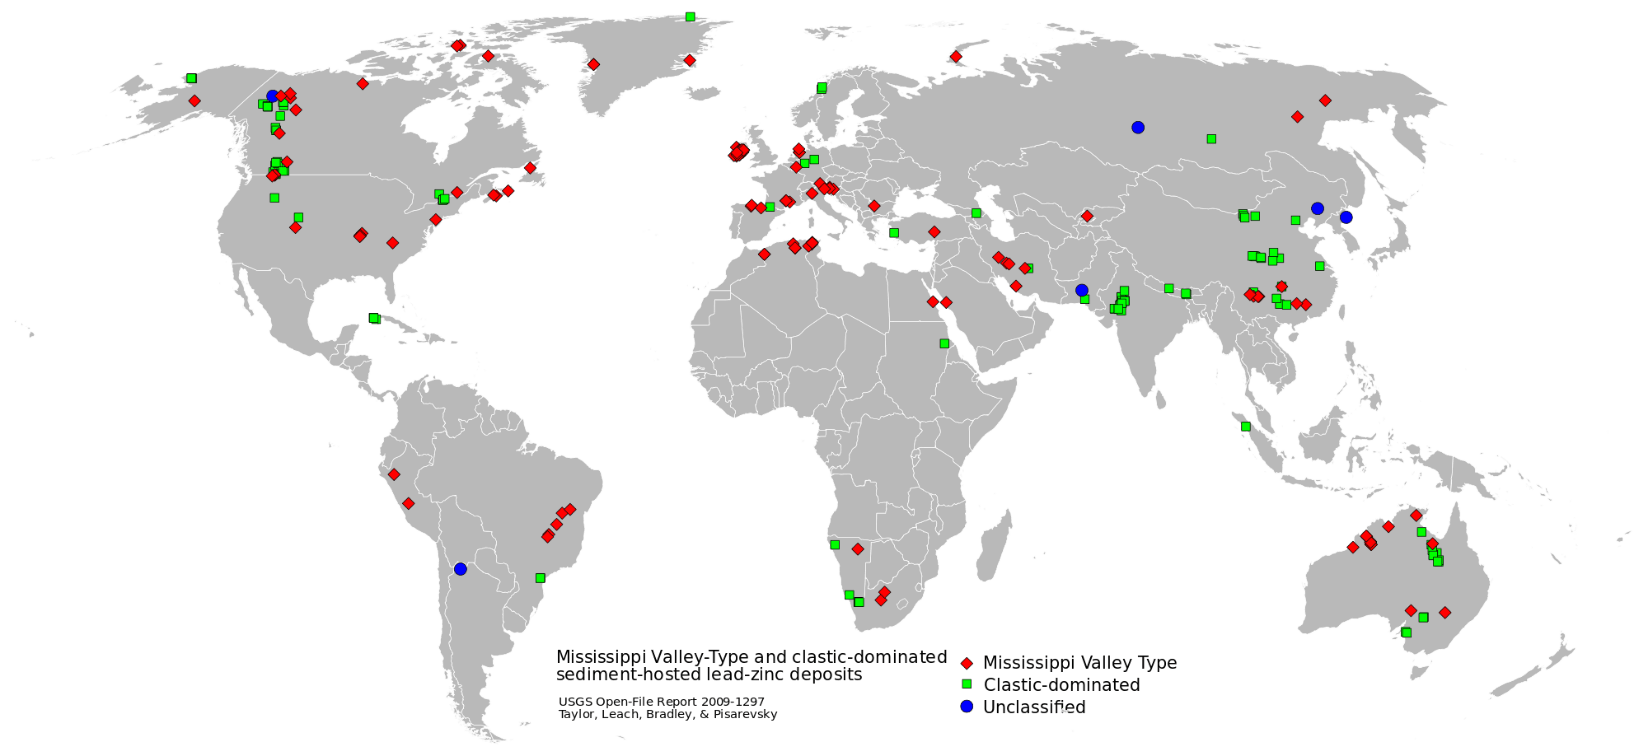
7.3 Distribution of Lead and Zinc ores – India and World 69
Gold Reserves and Production in India 71
World’s Gold Reserves and Gold Production 73
Silver Reserves and Production – India & World 74
9. Ores of Metals used in Alloys 75
Manganese ore distribution in India 75
Manganese ore distribution across the World 77
Distribution of Wolfram in India and across the World 78
Copper Ore Distribution and Production in India 79
Distribution of Copper Ore and Production Across the World 81
Distribution of Nickel in India and World 82
Chromite Distribution across India and World 84
Distribution of Cobalt Reserves across India and the World 85
KABIL Set up to Ensure Supply of Critical Minerals 86
11. Non Metallic: Graphite and Diamond 87
Distribution of Graphite across India and World 88
Distribution of Diamond Bearing rocks and gravels in India 89
Differences Between Graphite and Diamond 91
12. Non Metallic: Limestone, Dolomite and Magnesite 92
Distribution of Limestone in India 93
13. Other Non-Metallic Mineral Resources 94
Uranium Reserves and Production across the World 97
Nuclear Power Plants in India 99
Economic Geography
- Economic geography is the study of patterns of humans’ economic activities ranging from production to consumption of various goods and services across the world.
- By ‘human economic activities’ we mean, production, location, distribution, consumption, exchange of resources, spatial organization of economic activities, etc.
- Different subject matters of economic geography include the distribution of mineral resources, location of industries, economies of agglomeration (economies of urbanization), transportation, international trade, the relationship between the environment and the economy, etc.
Importance of studying economic geography:
- It allows us to understand an area’s economy and its economic relationship with other areas around the world.
- It helps us understand the reasons and methods of development of a region or lack of development thereof.
- It helps us find solutions to economic developmental challenges.
GS1 Syllabus:
- Distribution of key natural resources across the world (including South Asia and the Indian sub-continent); {Economic Geography Part I}
- factors responsible for the location of primary, secondary, and tertiary sector industries in various parts of the world (including India). {Economic Geography Part II}
GS3 Syllabus:
- Major crops cropping patterns in various parts of the country, different types of irrigation and irrigation systems storage. {Indian Agriculture}
- Infrastructure: Energy, Ports, Roads, Airports, Railways etc. {Will be covered as a separate topic}
| Natural Resources Classification | |
| Biotic | Abiotic |
| Renewable (Non-conventional): biomass, solar energy, wind energy, etc. | Non-renewable (Conventional): coal, oil, iron, etc. |
| Metallic: Iron, copper, tin, zinc, uranium (heavy metal), etc. | Non-metallic: graphite, diamond, mica, limestone, etc. |

Renewable and Non-renewable energy resources will be covered as a part of General Science and Science and Technology.
Iron
Types of Iron Ore
- Based on the amount of ore and iron content, iron ore is classified into various types.
- Magnetite (Fe3O4) and Haematite (Fe2O3) are fine quality ores.
- Limonite, siderite, etc. are inferior ores that have their own unique characteristics.
Magnetite (Fe3O4)
- Magnetite has excellent magnetic qualities, hence the name.
- It is black in colour and has very high content of Iron – upto 72 per cent (best quality iron ore).
- Magnetite has higher iron content than hematite (60-70 per cent); therefore, its quality is higher.
- However, unlike haematite ore, magnetite ore is not found in high grades.
- That is, while hematite ore generally contains large concentrations of hematite, magnetite ore generally holds low concentrations of magnetite.
- Hence the ore needs to be beneficiated (treat to improve its properties) for magnetite recovery.
- End products (e.g. steel) made from magnetite ore are typically of higher quality than those made from hematite ore. That’s because magnetite has fewer impurities than hematite.
- Magnetite with less iron content (25% to 30%) is known as Taconite.
- A naturally magnetized content of magnetite is called lodestone.
- Distribution of magnetite ore in India: Dharwad and Cuddapah systems – Karnataka (73%), Andhra Pradesh (14%), Tamil Nadu (5%), Rajasthan (5%), etc.
Haematite (Fe2O3)
- Reddish ore with naturally high iron content – 60 to 70 per cent.
- Because of its high iron content, hematite ore can be used in steel production without benefaction.
- Hematite is the most abundantly available ore in India.
- Distribution: Odisha, Jharkhand, Chhattisgarh, Andhra Pradesh, Karnataka, Maharashtra and Goa.
Limonite
- Limonite is inferior iron ore that is yellowish in colour with 40 to 60 per cent iron content.
- Limonite mines are open cast mines; hence mining is easy and cheap.
- Distribution: Damuda series in Raniganj coal field, Garhwal in Uttarakhand, Mirzapur in Uttar Pradesh and Kangra valley of Himachal Pradesh.
Siderite (FeCO3)
- It is iron carbonate ore of inferior quality with less than 40 per cent iron content.
- It contains many impurities and hence mining, in many places, is economically unviable.
- However, one good quality of the ore is that it doesn’t contain sulphur or phosphorus.
- And also, it is self-fluxing due to the presence of lime.
Iron Ore Distribution Across the World
Iron Ore in China: Manchuria, Sinkiang, Si-kiang, Shandog Peninsula

Iron Ore in Europe: Ruhr, South Whales, Krivoy Rog, Bilbao, Lorraine

Iron ore in Africa: Transvaal, Liberia

Iron ore in Russia, Kazakhstan: Ural region, Magnitogorsk

Iron Ore in North America: Great Lakes (Mesabi Region), Labrador

Iron Ore in South America: Carajas, Itabira, Minas Geriais
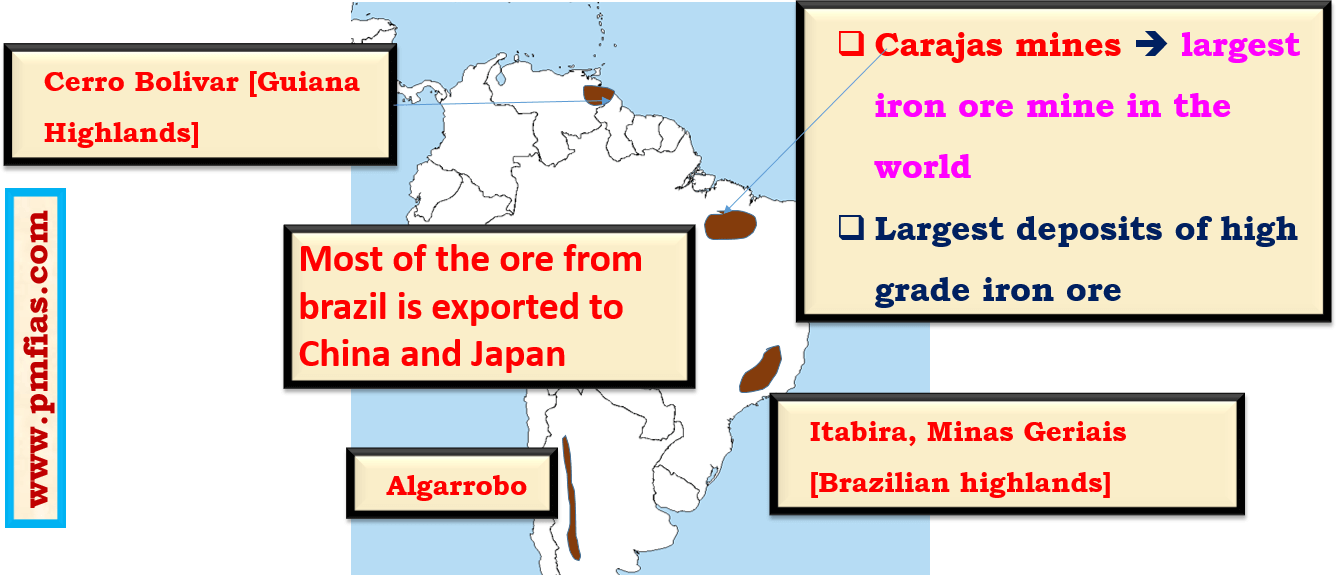

- Brazil has one of the largest reserves of high grade hematite ore.
Iron Ore in Australia: Pilbara Region, Koolyanobbing, Iron Duke, Iron Knob

Largest iron ore producers
| Country | Iron Ore Production |
|
900 Million tonnes – most of the ore is exported to China. |
|
490 Million tonnes – most of the ore is exported to China. |
|
340 Million tonnes – very high demand for iron in the region. |
|
210 Million tonnes – Post SC ban on mining in Goa, Odisha and Karnataka in 2010, India’s import of iron ore grew substantially. |
Largest iron ore reserves
| World Total | 840 billion tons |
|
240 billion tons |
|
170 billion tons |
|
140 billion tons |
|
69 billion tons |
|
32 billion tons |
Top Iron ore producers in the world
- All the data is in million tonnes.
| Year | 2017 | 2018 |
|
1229 | ~1300 – very high demand for iron in the region. |
|
885 | 900 – most of the ore is exported to China. |
|
436 | 490 – most of the ore is exported to China. |
|
201 | 210 (~4.7%) – Post SC ban on mining in Goa, Odisha and Karnataka in 2010, India’s import of iron ore grew substantially. |
|
95 |
- India had produced 209.00 million tonnes of iron ore in 2010, before the clampdown on illegal mining in the country by the Supreme Court.
Iron Ore Distribution in India
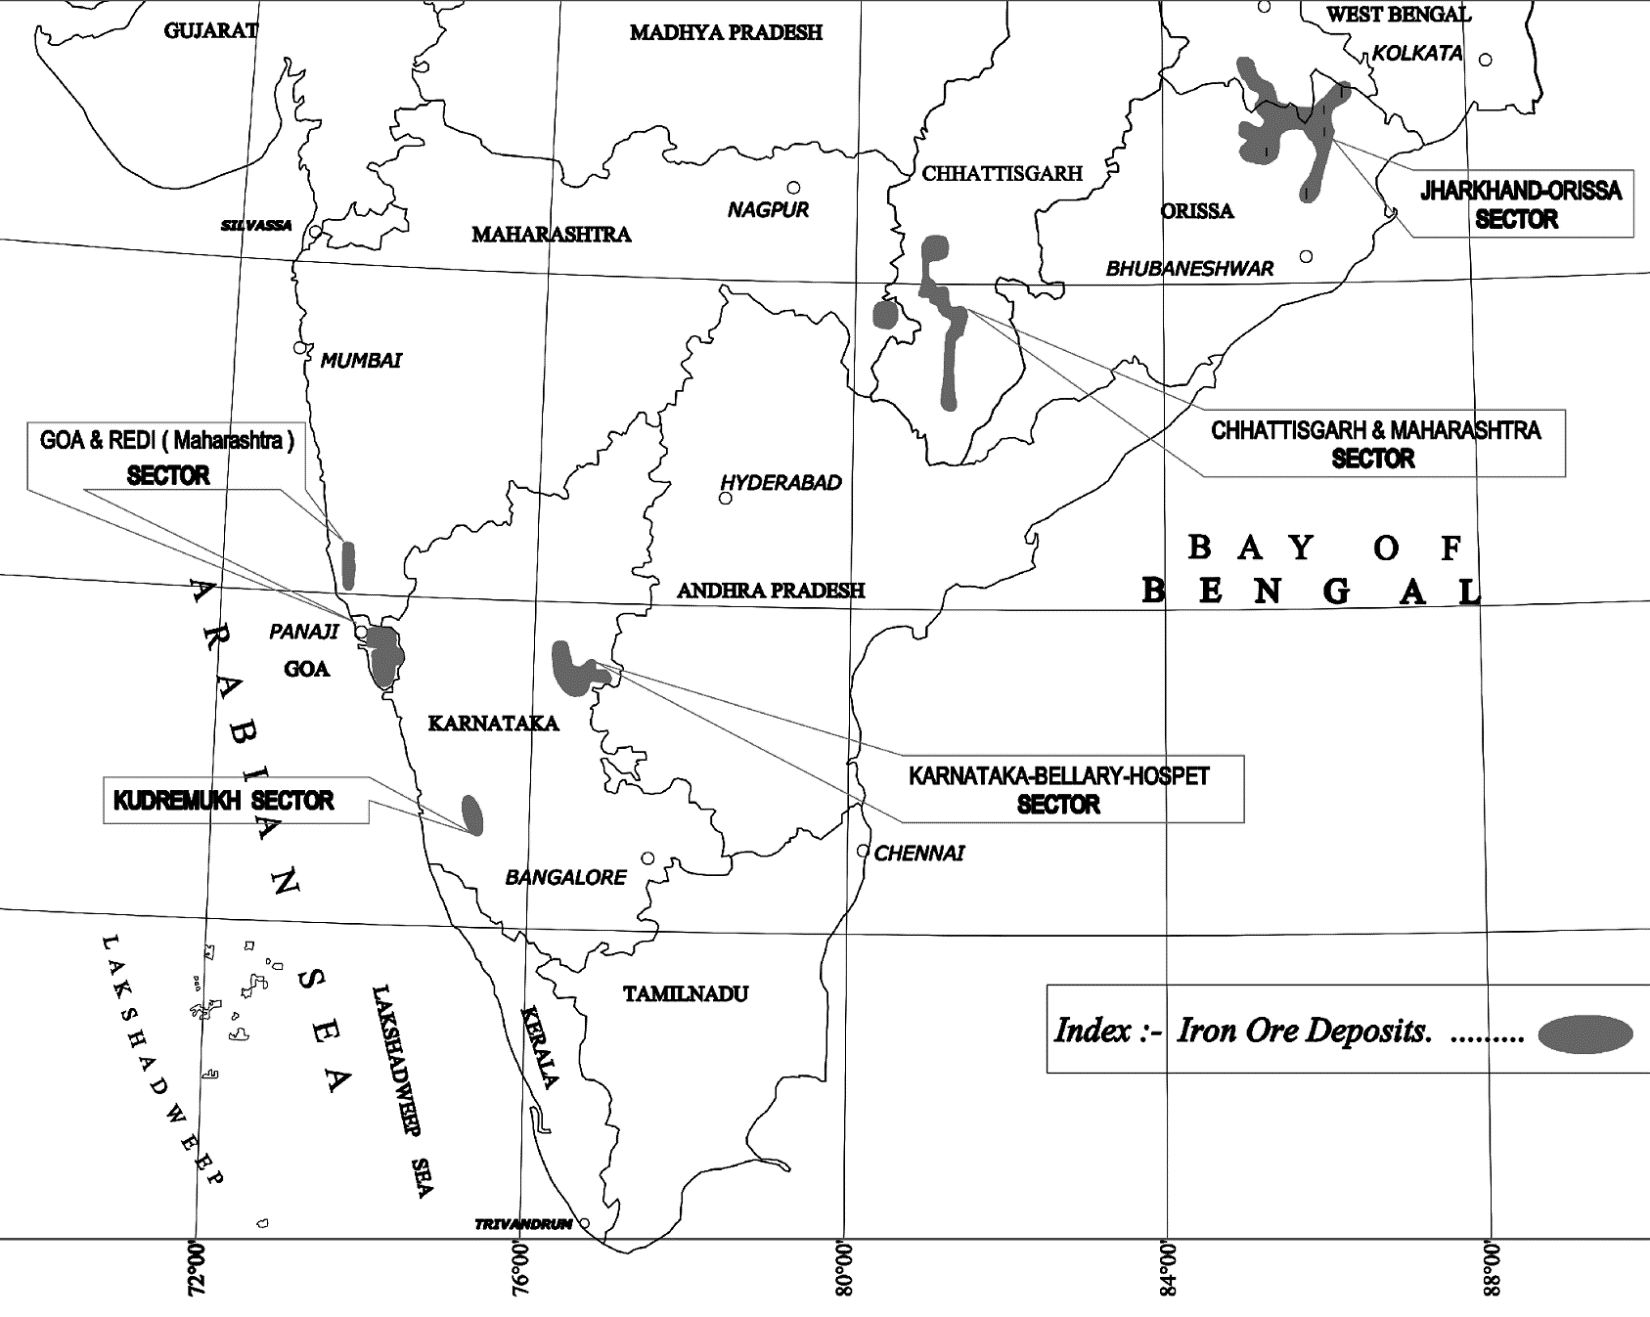

- In India, the main deposits of iron ore are located in the states of Odisha, Jharkhand, Chhattisgarh, Karnataka and Goa, with Odisha contributing ~50% of India’s total production.
- Hematite and magnetite are the two most important iron ores in India.
- Of these, hematite is considered to be the most important iron ore because of its high grade quality, which is consumed by a large number of steel & iron industries in the country.
- Most of the larger iron ore belts already explored for high-grade ores have been exploited through the last six decades.
- The country has huge resources/reserves of low-grade iron ore but mining efforts to tap low-grade ores have not been adequate.
| Ore | Reserve resource | Remaining resource | Total resource (total reserves) |
| Hematite | 5 billion tons | 17 billion tons | 22.5 billion tons |
| Magnetite | 52699 million tons (0.2%) | 10.7 billion tons | 10.8 billion tons |
- Reserve Resource (total recoverable reserves): can be commercially exploited at present.
- Remaining resource (total unrecoverable reserves): cannot be commercially exploited at present due to low grade ore or lack of adequate technology or environmental concerns, etc.
Haematite reserves |
Magnetite reserves |
Rest in Andhra Pradesh, Karnataka, Goa, Assam, Bihar, Maharashtra, MP, etc. |
|
Hematite reserves
- Almost the entire present-day production of iron & its products comes from hematite reserves.
- Around 96% of hematite resources are confined in Orissa, Jharkhand, Chhattisgarh, Karnataka and Goa.
- In Jharkhand & Orissa and in adjoining areas in eastern India, hematite occurs associated with limonite.
- In Bellary-Hospet region of Karnataka, hematite ore occurs with minor amounts of magnetite.
- Important hematite accumulations are in Singhbhum district (Jharkhand), Keonjhar (Orissa), Bellary (Karnataka), Bastar district (Chhattisgarh) and Goa.
Magnetite reserves
- Magnetite reserves are not being exploited as these are mostly in eco-fragile areas of the Western Ghats.
- Magnetite would remain locked up until environmentally sustainable mining technologies are invented.
- Magnetite ore deposits are mainly confined to the Chikmagalur district (Kudremukh (Bababudan hills)) in Karnataka and Salem and North Arcot districts in Tamil Nadu.
Q1. Statements
- Karnataka has more than half of the reserves of magnetite ore in India.
- Jharkhand has the highest reserves of haematite ore in India.
Which of the above are true?
- Both
- 1 only
- 2 only
- None
| Odisha |
|
| Chhattisgarh |
|
| Jharkhand |
|
| Karnataka |
|
Iron ore in other states
|
|
Iron Ore Production in India
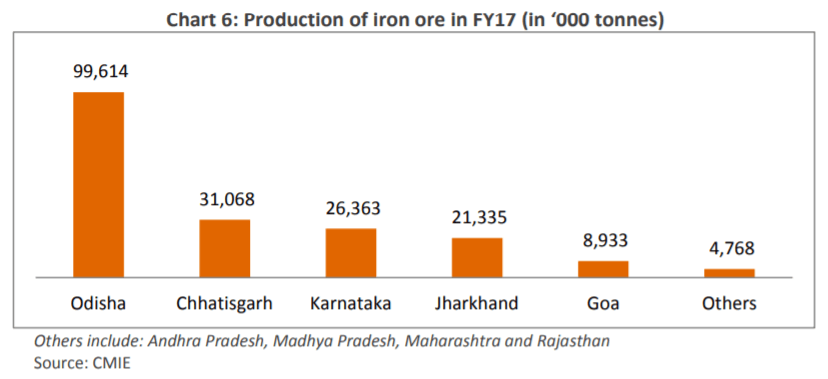

- The total iron ore production in India in FY17 stood at ~192mn tonnes.
- Indian exports of iron ore stood at 24.1 mn tonnes and imports were 8.7 mn tonnes in FY18.
- Sale of iron ore from Karnataka mines had fallen sharply with domestic steel producers buying the ore from Chhattisgarh and Odisha due to better quality at cheaper price.
Coal
- Coal is also called black gold. It is found in sedimentary strata (layers).
- Coal contains carbon, volatile matter, moisture and ash (in some cases Sulphur and phosphorous).
Formation of Coal


- Most of the world’s coal was formed in Carboniferous age (350 million years ago – Best quality coal).
- The name Carboniferous refers to coal-bearing strata.
- Coal formed millions of years ago when the earth was covered with huge swampy (marshy) forests.
- As the plants grew, some died and fell into the swamp waters.
- New plants grew up to take their places and when these died still more grew.
- In time, there was thick layer of dead plants rotting in the swamp.
- The surface of the earth changed, and water and dirt washed in, stopping the decaying process.
- More plants grew up, but they too died and fell, forming separate layers.
- After millions of years many layers had formed, one on top of the other.
- The weight of the top layers and the water and dirt packed down the lower layers of plant matter.
- Heat and pressure produced chemical and physical changes in the plant layers which forced out oxygen and left rich carbon deposits. In time, material that had been plants became coal.


Older the coal, better the carbon content
|
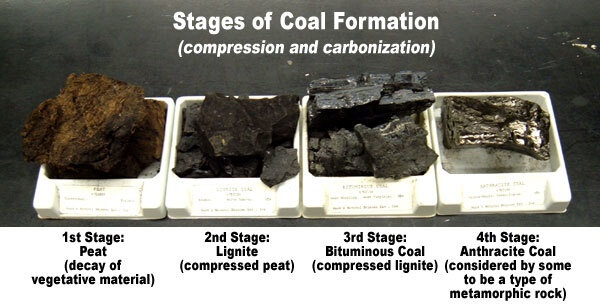
Stages of coal formation
- In the process of transformation (coalification),
- Buried plants turn into peat,
- Peat is altered to lignite,
- lignite is altered to sub-bituminous,
- sub-bituminous coal is altered to bituminous coal, and
- bituminous coal is altered to anthracite (oldest, best quality coal).

Classification of coal
- Coals are classified into peat, lignite, bituminous coal, and anthracite.
- These classifications are based on the amount of carbon, oxygen, and hydrogen present in the coal.
- Coal’s other constituents include hydrogen, oxygen, nitrogen, ash, and sulphur.
- Some of the undesirable chemical constituents include chlorine and sodium.
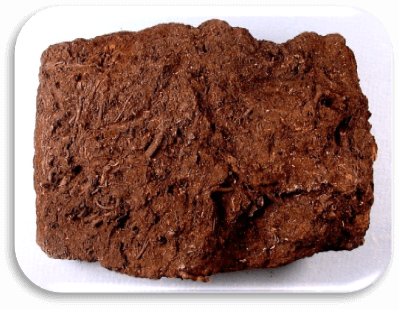
Peat
- Contains less than 40 to 55 per cent carbon (has more impurities).
- Contains sufficient volatile matter and lots of moisture (gives out a lot of smoke when burnt 🡺 pollution).
- Left to itself, it burns like wood, gives less heat, emits more smoke and leaves a lot of ash.

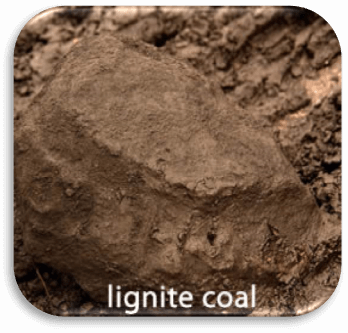
Lignite (brown coal)
- Contains 40 to 55 per cent carbon.
- Moisture content is high (over 35 per cent).
- It undergoes spontaneous combustion (this is undesirable because it creates fire accidents in mines).
- Distribution: Rajasthan, Lakhimpur (Assam), and Tamil Nadu.

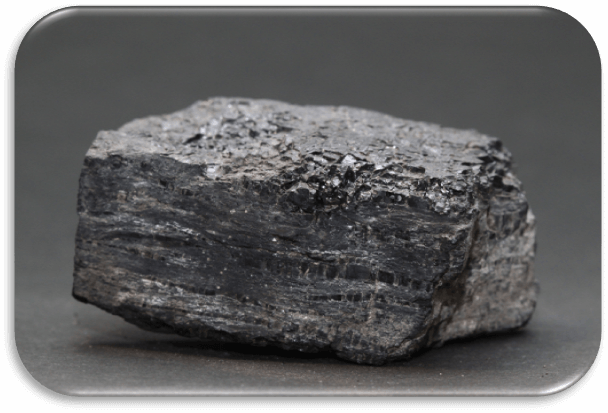
Bituminous Coal (black coal)
- Bituminous Coal is soft, dense, compact coal with 40 to 80 per cent carbon.
- Bituminous Coal is the most widely available and used coal.
- It derives its name after a liquid called bitumen.
- Moisture and volatile content are low (15 to 40 per cent).
- It does not have traces of original vegetable material.
- Calorific value is very high due to high proportion of carbon and low moisture.
- It is used in the production of coke and gas.
- Distribution: Jharkhand, Odisha, West Bengal, Chhattisgarh and Madhya Pradesh.

Anthracite Coal (Semi-metallic lustre)
- Anthracite coal is the best quality, hard coal with 80 to 95 per cent carbon.
- It has very little moisture and volatile matter.
- It ignites slowly and hence there is less loss of heat (highly efficient).
- It burns with a short blue flame (Complete combustion 🡺 Flame is blue 🡺 very few pollutants).
- In India, it is found only in Jammu and Kashmir and that too in small quantity.


Coking Coal vs. Non-Coking Coal (Thermal Coal)
| Coking Coal or Metallurgical Coal | Thermal Coal or Non-Coking Coal or Steaming coal |
|
(Sulphur reacts with iron to from iron sulphide (FeS). Iron sulphide is brittle (hard but easily breakable) and makes the whole metal and its alloys brittle.) |
|
|
|
|
|
|
Distribution of Coal in India
- Coal reserves are six times greater than oil and petroleum reserves.
- In India, during the year 2016-17, about 82% coal and lignite got despatched to the Power Sector.
Gondwana Coal (formed 250 million years ago)
- Around 98 per cent of India’s coal reserves and 99% of total coal production are from Gondwana fields.
- The carbon content in Gondwana coal (250 million years old) is less compared to the Carboniferous coal (350 million years old – almost absent in India) because of its much younger age.
- The volatile compounds and ash (~ 30%) don’t allow carbon percentage to rise above 60%. (It requires a few million years more for the quality has to get better).
- Gondwana coal is free from moisture, but it contains Sulphur and phosphorus.
- Coking as well as non-coking coal and bituminous coal are obtained from Gondwana coal fields.
- Anthracite is generally not found in the Gondwana coal fields.
- The Damuda series (i.e. Lower Gondwana) possesses the best worked coalfields accounting for 80 per cent of the total coal production in India.
- Gondwana coal occur in the valleys of certain rivers viz., the Damodar (Jharkhand-West Bengal); the Mahanadi (Chhattisgarh-Odisha); the Son (Madhya Pradesh Jharkhand); the Godavari and the Wardha (Maharashtra-Andhra Pradesh).
| Jharkhand |
Coking Coal Production by State
|
| Odisha |
|
| Chhattisgarh |
|
| West Bengal |
|
| Madhya Pradesh |
|
| Telangana & Andhra
Pradesh |
|
Tertiary Coal (formed 60 – 15 million years ago)
- Tertiary coal generally has low carbon and high percentage of moisture and Sulphur.
- Lignite deposits occur in the tertiary sediments in the extra-peninsular region particularly in Tamil Nadu, Kerala, Gujarat & Rajasthan and also in Jammu & Kashmir.
- The total known geological reserves of lignite as of 2017 is 44.7 billion tonnes, of which 80% reserves are located in Tamil Nadu.
- Peat deposits occur in Nilgiri hills and Kashmir valley (in the alluvium of the Jhelum).
| Maharashtra |
|
| Tamil Nadu |
|
| Rajasthan |
|
| Gujarat |
|
| Jammu
& Kashmir |
|
| Assam |
|
| Meghalaya |
|
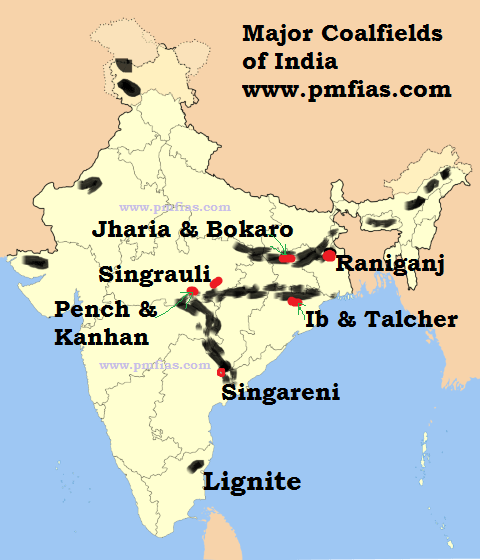
Major Coalfields in India
- Singrauli
- Karanpura Bokaro
- Jharia
- Raniganj
- Ib & Talcher
- Pench & Kanhan
- Singareni – Godavari Velley
- Lignite: TN, Gujrat And Rajasthan

State-wise coal reserves and coal production in India
- India has a total of 319 billion tons of coal reserves of which 148.8 billion tons are proven reserves.
| State-wise coal reserves in India | State-wise raw coal production in India | ||||
| State | Reserves (billion tons) | State | 2016-17 | 2017-18 | |
|
80.71 | 26.8 % |
|
139 | 143 |
|
75.07 | 24.9 % |
|
128 | 132 |
|
52.53 | 17.4 % |
|
118 | 112 |
|
31.31 | 10.4 % |
|
85 | 91 |
|
25.67 | 8.5 % |
|
40 | 41 |
|
22.48 | 7.5 % |
|
25 | 26 |
|
10.98 | 3.6 % |
|
16 | 18 |
The demand of coal, production, supply and import of coal in India
| Data in Million Tons (MT) | India’s coal imports country-wise | |||||
| Year | 2015-16 | 2016-17 | 2017-18 | Country | FY 2016-17 | FY 2017-18 |
| Total domestic Production | 639.23 | 657.87 | 676.48 |
|
117 | 97 |
| Total domestic Supply | 632.44 | 644.56 | 691.42 |
|
46 | 46 |
| Total Import (MT) | 203.95 | 190.95 | 208.27 |
|
38 | 35 |
- Coal India Ltd (CIL) has planned to increase coking coal output from 34.12 MT to 52.95 MT by 2019-20.
| In Million Tons (MT) | FY 2018-19 | Non-coking coal imports |
| Total coal imports | 220 |
|
| Non-coking coal imports | 164 | |
| Coking coal imports | 52 |
Why does India import coal although it has enough reserves?
Inability to exploit reserves
- Unavailability of technology to mine coal from deep underground coal mines (40% of total coal reserves are located at a deeper depth which cannot be extracted using opencast mining).
- Significant portions of Indian coal reserves are in Maoist affected regions and densely populated areas.
Short supply of coking coal (metallurgical coal)
- Coke is an important ingredient in the manufacture of iron (coke acts as fuel in a blast furnace).
- India has very few coking coal sources and hence it has to import it from Australia, Canada, South Africa, Indonesia, etc.
Environmental concerns
- India’s coal has high ash content and low caloric value. Hence burning it causes a lot of pollution.
- Previously, due to shortage of coal and pollution concerns, many Indian power plants had been designed to run on superior quality imported coal.
- Clean coal technology used to clean coal to reduce emissions is expensive and complex to setup.
Lack of dedicated freight corridors (railway lines for goods trains)
- The distribution of coal is uneven.
- The movement of freight in India is slow (goods trains have to make way for passenger trains) as Indian railways doesn’t have dedicated freight corridors.
- Hence it is sometimes convenient and/or less expensive to import coal.
Coal India is not able to meet the demand of captive power plants
- Aluminium smelters, cement makers and other industrial users that power their factories using their own coal powered power plants (captive power plants).
- Given these consumers have to run their captive power plants in order to produce their goods, they have no option but to turn to imports when Coal India can’t meet their needs.
- There is about 30 gigawatts (GW) of coal-fired generation capacity that is used by captive power plants.
Captive power plant: A captive power plant provides localised source of power to an energy user. These are typically industrial facilities or large offices.
Measures taken by the government to boost production
- Indian coal industry was plagued with low productivity, primitive technology, etc.
- Hence in 1975 public sector and private sector companies were liquidated to form Coal India Limited.
- Since 1975, all mining activities were undertaken only by Coal India Ltd. and its subsidiaries.
- The centralization of the coal industry resulted in lack of innovation and the sector soon became stagnant.
- In 2004, GOI decided to allocate coal blocks to private companies for captive mining (coal for personal use).
- But the procedure of allocation was embroiled in corruption (Coalgate scam: coal blocks were allocated without any competitive bidding during the period 2004–2009).
- GOI opened up commercial coal mining for the private sector in 2018 and approved the methodology for auction of coal mines / blocks for sale of coal.
Distribution of Coal across the World


| USA |
|
| China |
|
| Russia |
|
| Europe |
|
| Brazil |
|
| Australia |
|
| Africa |
|
Global Coal Reserves
- As of 2015, total proved recoverable reserves of coal were about 1.14 trillion tons.
- United States – 22%
- Russia – 16%
- Australia – 14%
- China – 13%
- India – 9%
Top coal producers and consumers in the world
| Top coal producers in the world (All data is in million tons) | Top coal consumers | ||||
| Country | 2016 | 2017 | Country | 2017 | |
| 1. China | 3411 | 3445 |
|
1890 | 51% |
| 2. USA | 700 | 775 |
|
424 | 11% |
| 3. India (Bituminous + Lignite) | 658 + 45 | 679 + 48 |
|
332 | 9% |
| 4. Australia (Bituminous & Brown coal) | 503 | 492 |
|
102 | 3% |
| 5. Indonesia (Anthracite & Bituminous) | 456 | 461 |
|
92 | 3% |
| 6. Russia | 385 | 410 | |||
| 7. South Africa (Anthracite & Bituminous) | 251 | 252 | |||
| World Total (All data is in million tons) | 7469 | 7632 | |||
Petroleum and Mineral Oil
- Petroleum (Petra means rock; Oleum means oil) is obtained from sedimentary rocks of the earth.
- Constituents of Petroleum include 90 to 95 per cent hydrocarbons and 5 – 10% organic compounds containing oxygen, nitrogen, sulphur and traces of organometallic compounds.
Formation of Petroleum and Mineral Oil


- Tiny sea plants and animals died and were buried on the ocean floor.
- Over time, they were covered by layers of sediment and rock.
- Over millions of years, the remains were buried deeper and deeper.
- The enormous heat and pressure turned them into oil and gas.
- Today, we drill down through the layers of sedimentary rock to reach the rock formations that contain oil and gas deposits.
Conditions for Formation of Petroleum and Mineral Oil
- All sedimentary rocks do not contain oil.
- An oil reservoir must have three prerequisite conditions.
- Porosity (tiny gaps in soil) so as to accommodate sufficiently large amounts of oil;
- Permeability (allowing liquids or gases to pass through) to discharge oil and/or gas when well has been drilled;
- Porous sandstone beds or fissured limestone containing oil should be capped below by impervious beds (not allowing fluid to pass through).
- Most of the oil gets collected in the anticlines or fault traps.
- Oil on a commercial scale is usually found in crests of anticlines (where the sedimentary rock strata are inclined and folded).
- Formation of exploitable reservoirs of hydrocarbons requires migration (from their source rocks) to geological traps comprising a porous reservoir rocks and overlain by an impermeable horizon.


Anticline trap (MagentaGreen, Wikipedia Commons)
- Common geological traps for hydrocarbons include shales, salt domes (evaporites; also rich in sulphur), and anticlinal folds of permeable and non-permeable strata.
- In addition to liquid hydrocarbons, natural gas is also common.


Oil and Gas traps (MagentaGreen, Wikipedia Commons)
Stratigraphic trap: an impermeable layer capable of retaining hydrocarbons.
Structural traps: cracks in faults and folds that can retain hydrocarbons.
Distribution of Petroleum and Mineral Oil in India
- Process of mineral oil formation began in tertiary period (3 million years ago).
- Most of the oil reserves in India are associated with anticlines and fault traps in the sedimentary rock formations of tertiary times.
- In tertiary period, aquatic life was abundant in various forms, especially the minor microscopic forms of flora and fauna.
- Conditions for oil formation were favourable especially in the lower and middle Tertiary period.
- Dense forests and sea organisms flourished in the gulfs, estuaries, deltas and the land surrounding them during this period.
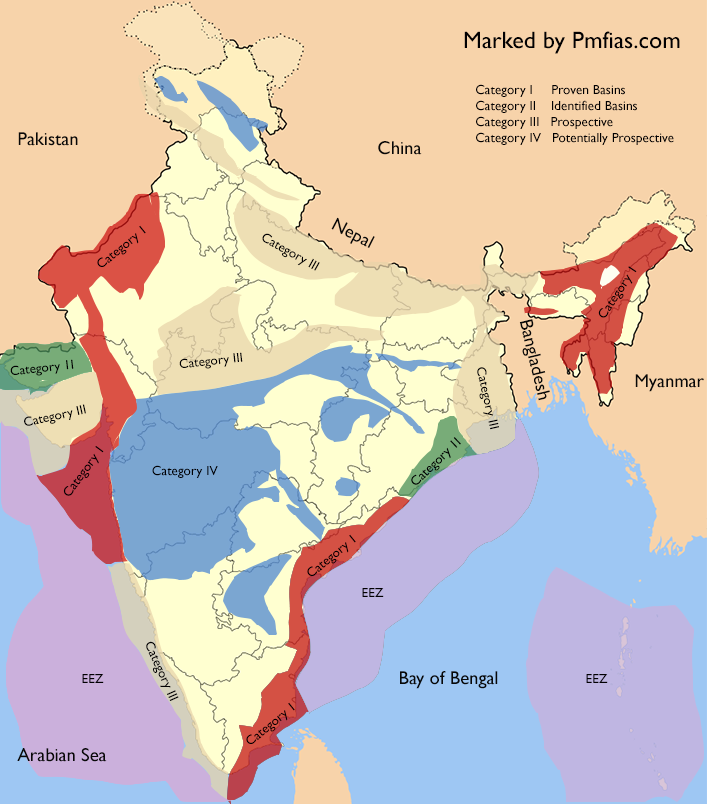
Extent of Oil Bearing Strata in India
- India has 26 sedimentary basins covering an area of 3.36 million square kilometres.
- The Indian sedimentary basins have been broadly divided into three categories:
| Type of Basins | Basins / Region: | ||||||||||||||||||||
| Category I (~10 lakh Km2) |
|
||||||||||||||||||||
| Category II (~7.8 lakh Km2) | Known accumulation of hydrocarbons but no commercial production as yet.
|
||||||||||||||||||||
| Category III (~15.9 lakh Km2) | Indicated hydrocarbon shows that are considered geologically prospectively.
|
||||||||||||||||||||

On-shore Oil Production in India
- Brahmaputra valley of north-east India.
- Barmer area of Rajasthan.
- Gujarat coast in western India.
- Cauvery on-shore basin in Tamil Nadu.
- Andhra Pradesh has both on-shore and offshore oil reserves.
| Assam Oilfields |
|
| Gujarat Oilfields |
|
| Rajasthan Oilfields |
|
Off-Shore Oil Production in India
| Western Coast |
|
| Eastern Coast |
|
State-wise crude oil and natural gas production trends
| State-wise crude oil production trends
(thousand metric tonnes) |
State-wise natural gas production trends
(MMSCMD: Million Metric Standard Cubic Meter Per Day) |
||
| State/Source | 2017-18 | State/Source | 2017-18 |
| Onshore | Onshore | ||
|
7887 |
|
8.8 |
|
4591 |
|
4.4 |
|
4345 |
|
4 |
|
345 |
|
3.9 |
|
322 |
|
3.3 |
|
50 |
|
2.6 |
| Total Onshore | 17540 | Total Onshore | 29.1 |
| Offshore | Offshore | ||
| Total Offshore | 18145 | Total Offshore | 60.3 |
| Total | 35684 | Total | 89.5 |
|
|||
Share of major fuels in Power Generation in India
| Total Installed Capacity (As on 31.05.2019) | |||
| Fuel | Giga Watt | % share | |
| Thermal | Total Thermal | 226.3 | 63.2% |
| Coal | 194.5 | 54.3% | |
| Lignite | 6.3 | 1.7% | |
| Gas | 24.9 | 7.0% | |
| Oil | 0.64 | 0.2% | |
| Hydro (Renewable) | 45.4 | 12.7% | |
| Nuclear | 6.8 | 1.9% | |
| Renewable | 79.3 | 22.0% | |
| Total | 357.9 | ||
India’s Oil Imports
- Import of crude oil during FY 2017-18 was 220.43 MMT (INR 5,66,450 crore or $87 bn).
| Country | 2015-16 | 2016-17 | 2017-2018 (MMT – Million Metric Tons) | ||
| Iraq | 36.8 | 37.75 | 45.74 | 20.8 % | Iraq toppled Saudi Arabia to become the largest crude oil supplier for India. |
| Saudi Arabia | 40.4 | 39.33 | 36.16 | 16.4 % | |
| Iran | 12.7 | 27.14 | 22.59 | 10.2 % | Imports declined due to US sanctions. |
| Venezuela | 23.6 | 21.43 | 18.34 | 8.3 % | |
| Nigeria | 23.4 | 17.7 | 18.11 | 8.2 % | OPEC members reached a deal to cut oil production and boost the market. |
| UAE | 15.7 | 19.3 | 14.29 |
|
|
Oil Refiners in India
- India’s first oil refinery started working way back in 1901 at Digboi in Assam.
- In 1954 a refinery was setup at Tarapur (Mumbai).
- Refinery hub and refining capacity exceeds the demand.
- Excess refined oil and other petroleum products are exported.
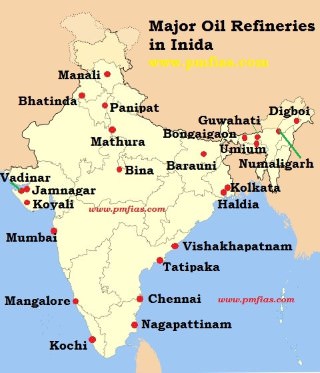

| Refinery Location | Capacity (MMTPA)* |
| SEZ, Jamnagar, Gujarat (RIL – private sector) | 35 |
| DTA-Jamnagar (RIL – private sector) | 33 |
| Vadinar, Gujarat (Essar Oil – private sector) | 20 |
| Kochi, Kerala (BPCL) | 15 |
| Panipat, Haryana (IOCL) | 15 |
| Paradip, Odisha (IOCL) | 15 |
| Mangalore, Karnataka (MRPL) | 15 |
| Koyali, Gujarat (IOCL) | 13 |
| Mumbai, Maharashtra (BPCL) | 12 |
| Bathinda, Punjab (JV refinieries) | 11 |
| Manali, Tamil Nadu (CPCL) | 10 |
| Visakhapatnam, Andhra Pradesh (HPCL) | 8.3 |
| Mathura, U.P (IOCL) | 8 |
| Bina, MP (JV refineries) | 7.8 |
| Haldia, West Bengal (IOCL) | 7.5 |
| Mumbai, Maharashtra (HPCL) | 7.5 |
| Barauni, Bihar (IOCL) | 6 |
| Numaligarh, Assam (Numaligarh Refinery Ltd.) | 3 |
| Bongaigaon, Assam (IOCL) | 2.35 |
| Guwahati, Assam (IOCL) | 1 |
| Nagapattinam (CPCL) | 1 |
| Digboi, Assam (IOCL) | 0.65 |
| Tatipaka, AP | 0.066 |
| Total | 249 |
| MMTPA: Million Metric Tonne Per Annum
BPCL: Bharat Petroleum Corporation Limited (Public Sector Units) CPCL: Chennai Petroleum Corporation Limited (Public Sector Units) HPCL: Hindustan Petroleum Corporation Limited (Public Sector Units) IOCL: Indian Oil Corporation Limited (Public Sector Units) |
|
Crude Oil Pipelines
- Salaya-Mathura Pipeline (SMPL)
- Paradip-Haldia-Barauni Pipeline (PHBPL)
- Mundra-Panipat Pipeline (MPPL)
Petroleum Product Pipelines
- Guwahati-Siliguri Pipeline (GSPL)
- Koyali-Ahmedabad Pipeline (KAPL)
- Barauni-Kanpur Pipeline (BKPL)
- Panipat-Delhi Pipeline (PDPL)
- Panipat-Rewari Pipeline (PRPL)
- Chennai – Trichy – Madurai Product Pipeline (CTMPL)
- Chennai-Bangalore Pipeline
- Naharkatia-Nunmati-Barauni Pipeline 🡺 first pipeline constructed in India
- Mumbai High-Mumbai-Ankleshwar-Koyali Pipeline.
- Hajira-Bijapur-Jagdishpur (HBJ) Gas Pipeline 🡺 world’s largest underground pipeline
- Jamnagar-Loni LPG Pipeline 🡺 longest LPG pipeline in the world
- Kochi-Mangalore-Bangalore pipeline
- Vishakhapatnam Secunderabad pipeline
- Mangalore-Chennai pipeline
- Vijayawada-Vishakhapatnam pipeline
Advantages of Pipeline
- Ideal to transport liquids and gases.
- Pipelines can be laid through difficult terrains as well as under water.
- Economical.
- It needs very little maintenance.
- Pipelines are safe, accident-free and environmentally friendly.
Disadvantages of Pipelines
- It is not flexible, i.e., it can be used only for a few fixed points.
- Its capacity cannot be increased once it is laid.
- It is difficult to make security arrangements for pipelines.
- Detection of leakage and repair is also difficult.


World distribution of Petroleum and Mineral Oil
- The amount of oil a given region produces is not always proportionate to the size of its proven reserves.
- For example, the Middle East contains more than 50 percent of the world’s proven reserves but accounts for only about 30 percent of global oil production.
- The United States, by contrast has less than 2 percent of the world’s proven reserves but produces about 10 percent of the world’s oil.
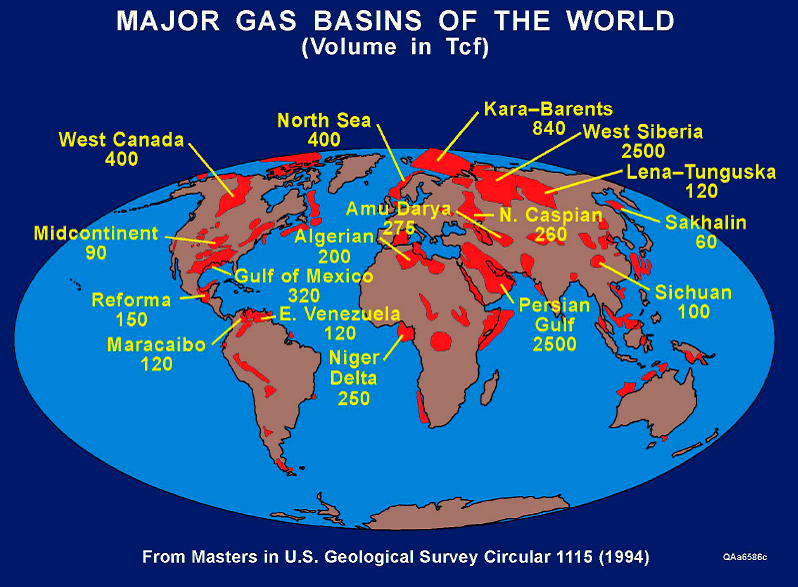
Supergiants
- Petroleum is contained in a few large fields, but most fields are small.
- The two largest classes of fields are the
- supergiants, fields with 5 billion or more barrels of ultimately recoverable oil, and
- world-class giants, fields with 500 million to 5 billion barrels of recoverable oil.
- Fewer than 40 supergiant oil fields have been found worldwide.
- The Arabian-Iranian sedimentary basin in the Persian Gulf region contains two-thirds of these supergiant fields.
- The remaining supergiants are distributed in the United States, Russia, Mexico, Libya, Algeria, Venezuela, and China.


Countries with The Largest Proven Oil Reserves
| Country | OPEC member? | Reserves (billions of barrels), 2018 | |
|
Yes | 302.8 | 19 % |
|
Yes | 267 | 17 % |
|
NO | 170 | 11 % |
|
Yes | 159 | 10 % |
|
Yes | 145 | 9 % |
|
Yes | 101.5 | 6 % |
|
Yes | 98 | 6 % |
|
NO | 80 | 5 % |
|
Yes | 48 | 3 % |
|
NO | 40 | 2 % |
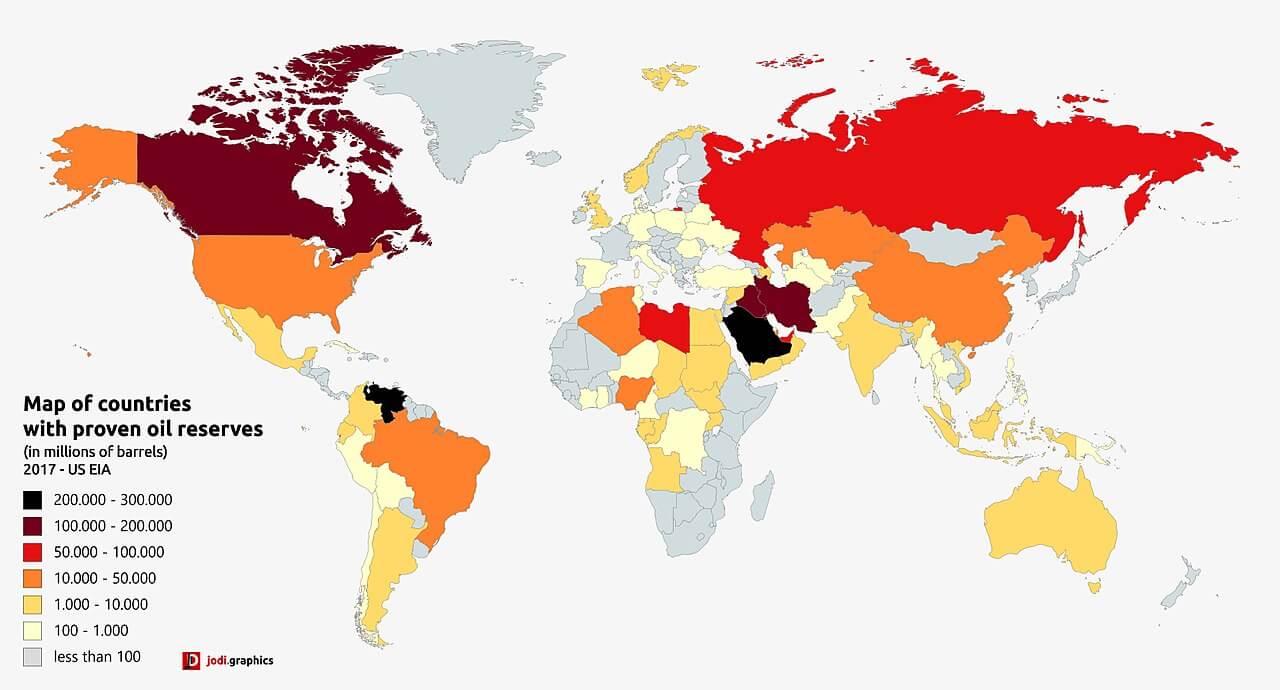

Image Source: Wikipedia
| Saudi Arabia |
|
| Iraq, Kuwait, Iran |
|
| Russia |
|
| North America |
|
| Venezuela |
|
| Western Europe |
|
| Africa |
|
World’s Top Producers, Consumers and Exporters of Oil
| Top Crude Oil Producers (2018) | Top Crude Oil Consumers (2017) | Top Crude Oil Exporters
(% share) |
||||
| Country | Million barrels/day | Country | Million barrels/day | |||
|
17.8 | 18% |
|
19.8 | 20% |
|
|
12.4 | 12% |
|
12.7 | 13% |
|
|
11.4 | 11% |
|
4.6 | 5% |
|
|
5.2 | 5% |
|
3.9 | 4% |
|
|
4.8 | 5% |
|
3.2 | 4% |
|
| India (11th place) | 2.5 | 3% | ||||
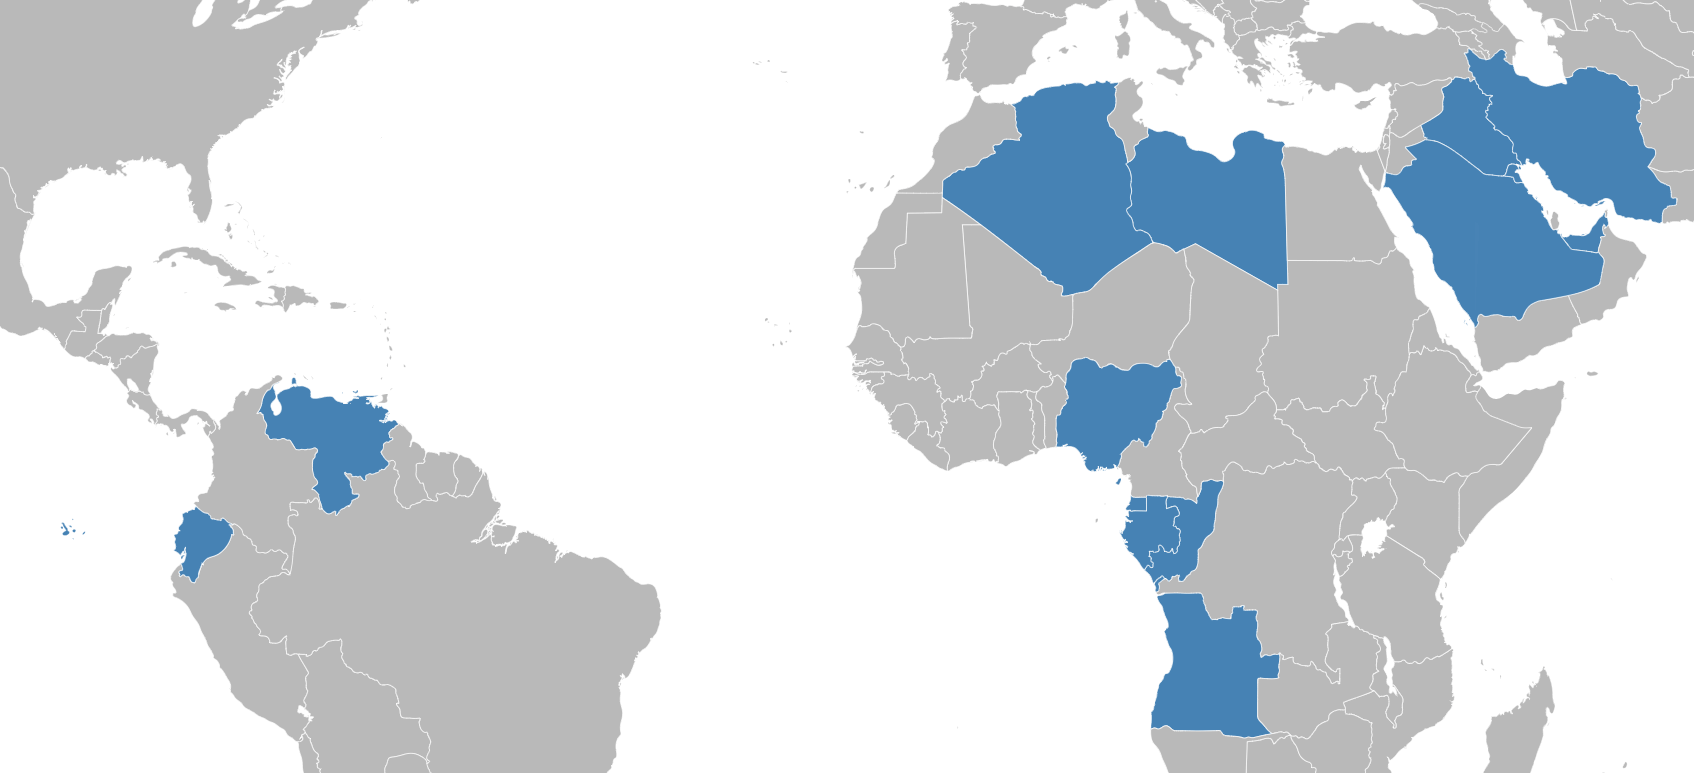
OPEC – Organization of Petroleum Exporting Countries
- OPEC is a 14 member oil supply cartel.
- It is founded by the first five members (Iran, Iraq, Kuwait, Saudi Arabia, and Venezuela).
- This group bargains with international Oil Companies to maximize their profit margin.
- They control production and supply of crude oil to keep it below international demand.
- The current OPEC members are the following: Algeria, Angola, Ecuador, Equatorial Guinea, Gabon, Iran, Iraq, Kuwait, Libya, Nigeria, the Republic of the Congo, Saudi Arabia, United Arab Emirates, and Venezuela. Indonesia and Qatar are former members.

Natural gas
- Natural gas consists of primarily methane and ethane. (LPG is a mixture of butane and propane)
- Propane, butane, pentane, and hexane are also present.
- Natural gas is formed during the process of formation of Petroleum.
- Hence, it is often found dissolved in oil or as a gas cap above the oil.
- Sometimes, pressure of natural gas forces oil up to the surface. Such natural gas is known as associated gas or wet gas.
- Some reservoirs contain gas and no oil. This gas is termed non-associated gas or dry gas.
- Often natural gases contain substantial quantities of hydrogen sulphide or other organic sulphur compounds. In this case, the gas is known as “sour gas.”
- Coalbed methane is called ‘sweet gas’ because of its lack of hydrogen sulphide.
Oil + Gas 🡺 Associated Gas or Wet Gas,
Only Gas 🡺 Non-Associated Gas or Dry Gas,
Hydrogen Sulphide in gas 🡺 Sour Gas,
Coalbed Methane 🡺 Sweet Gas.
- On the market, natural gas is usually bought and sold not by volume but by calorific value.
- In practice, purchases of natural gas are usually denoted as MMBTUs (millions of British thermal units – BTU or Btu) = ~1,000 cubic feet of natural gas.
Uses of Natural Gas
- Electric power generation.
- Many buses and commercial vehicles now operate on Compressed Natural Gas (CNG).
- Ammonia is manufactured using hydrogen derived from methane.
- Ammonia is used to produce chemicals such as nitric acid, urea, and a range of fertilizers.
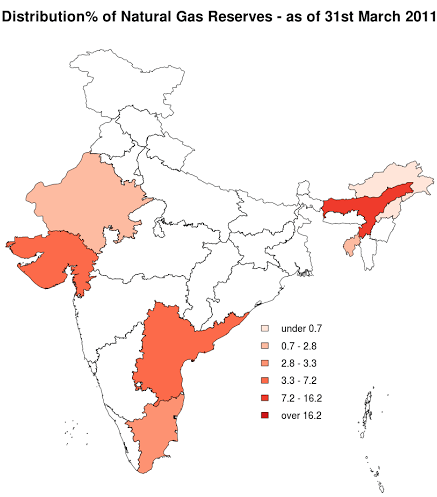
Distribution of Natural Gas across Indian and the World

Top natural gas producers, consumers, and countries with highest reserves
| Proven Reserves 2018 (Trillion m³) | Production 2018 (Billion m³) | Consumption 2018 (Billion m³) | |||
| Country | Reserves | Country | Production | Country | Consumption |
|
47.8 |
|
864 |
|
848 |
|
33.7 |
|
741 |
|
505 |
|
24 |
|
232 |
|
275 |
|
15 |
|
188 |
|
219 |
| Leading exporters: Russia, Qatar, Norway
Leading Importers: China, Japan, European Union countries like Germany, Italy, etc. |
|||||
- India proven gas reserves of 1.3 Billion m³.
- Indian consumed only 55 Billion m³ of natural gas in 2018.
| Russia |
|
||||||||||||||||
| North America |
|
||||||||||||||||
| Europe |
|
||||||||||||||||
| Africa |
|
||||||||||||||||
| Middle East |
|
||||||||||||||||
| Asia |
|
||||||||||||||||
| India |
Domestic Allocation and Supply of Natural GasDomestic Natural Gas and (ii) Imported Re-gasified Liquefied Natural Gas (R-LNG).
|

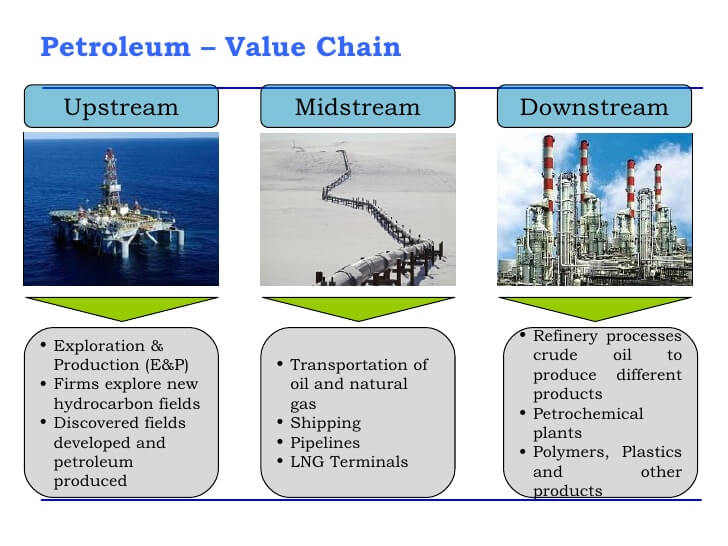
Petroleum and Gas Value Chain
- Oil & gas industry is divided in Upstream, Midstream and Downstream sector.


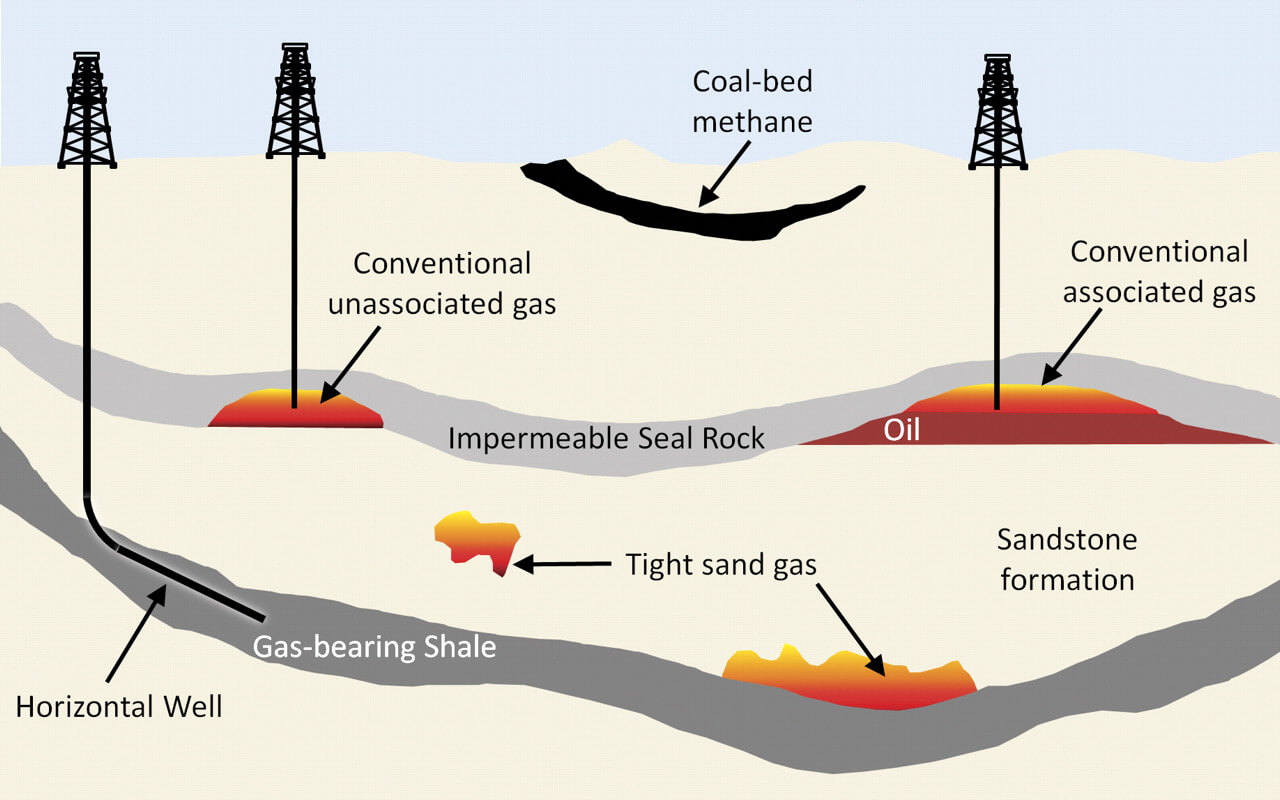
Unconventional Gas Reservoirs
- Conventional reservoirs of oil and natural gas are found in permeable sandstone.
- Unconventional Gas Reservoirs occur in relatively impermeable sandstones, in joints and fractures or, absorbed into the matrix of shales (shale is a sedimentary rock), and in coal seams.
- Examples of unconventional gas resources: Tight gas, shale gas, and coal-bed methane.
- Extraction of unconventional gas requires specialized technology which is expensive & complex to develop.
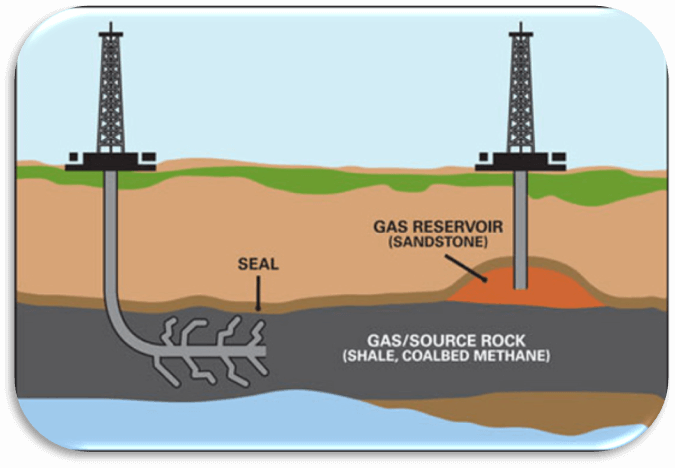

Unconventional Gas Reservoir
Coalbed Methane
- Considerable quantities of methane is trapped within coal seams (underground coal deposits).
- A significant portion of this gas remains as free gas in the joints and fractures of the coal seam.
- Large quantities of gas are adsorbed on the internal surfaces of the micropores within the coal itself.
- This gas can be accessed by drilling wells into the coal seam and pumping large quantities of water that saturate the seam (water will occupy the gaps and pores and will push out the gas).
- Coalbed methane is now becoming an important source of natural gas.
- Unlike much natural gas from conventional reservoirs, coalbed methane contains very little heavier hydrocarbons such as propane or butane.
- The presence of this gas is well known from its occurrence in underground coal mining, where it presents a serious safety risk.
Fire Accidents in Coal Mines are mainly due to Coalbed Methane, and Lignite deposits (undergo spontaneous combustion).
Coalbed Methane in India
- With one of the largest proven coal reserves, and one of the largest coal producers in the world, India holds significant prospects for commercial recovery of coalbed methane.
- It is estimated that India may produce about 5.5 million standard cubic meters of CBM by the end of 2018.
- At present, in many coal mines, coal mine methane is not trapped and is blown out.
- At present CBM is produced from some virgin coal mines – Jharia in Jharkhand, Raniganj East and South in West Bengal and Sohagpur West in Madhya Pradesh.
| State | Estimated CBM Resources (BCM) |
|
722 |
|
360 |
|
351 |
|
243 |
|
240 |
|
218 |
|
218 |
| Total CBM Resources | GOI has identified CBM Resources of 2,600 billion cubic meters (91.8 TCF). |
Problems in Exploration, Extraction of Coalbed Methane in India
- The state-run firms are holding mines in joint venture with private companies and the latter do not have rights to explore unconventional gas resources –– coalbed methane, shale gas, tight gas.
- CBM extraction falls under Ministry of Petroleum & Natural Gas whereas coal mining falls under Ministry of Coal.
- Hence, contractors are not allowed to mine gas from coal seams or coal bed methane (CBM) and coal in the same block due to the turf war between the two ministries and other associated bureaucratic hurdles.
- The technology required is very advanced and the public sector companies have very weak organizational setup to efficiently handle such technologies and extract gas economically.
- Private sector companies have necessary financial capabilities and managerial skills but there is no hope due to restricting laws and low gas prices.
Shale Gas
- Shale gas is a mixture of lot of methane + little ethane, propane, & butane + very little carbon dioxide, nitrogen, and hydrogen sulphide.
- Shales are fine-grained sedimentary rocks formed of organic-rich mud at the bottom of ancient seas.
- Subsequent sedimentation and the resultant heat and pressure transformed the mud into shale and also produced natural gas from the organic matter contained in it.
- Over long spans of geologic time, some of the gas migrated to adjacent sandstones and was trapped in them, forming conventional gas accumulations.
- The rest of the gas remained locked in the nonporous shale.
Extraction of Shale Gas
- Different types of sedimentary rocks contain natural gas, for example sandstones, limestones and shales.
- Sandstone rocks often have high permeability, which means that the tiny pores within the rock are well connected and gas can flow easily through the rock.
- In contrast, shale rocks where gas is trapped as a continuous accumulation throughout a large area usually have very low permeability, making gas production more complex and costly.
- Shale gas occurs frequently at depths exceeding 1,500 metres (5,000 feet).
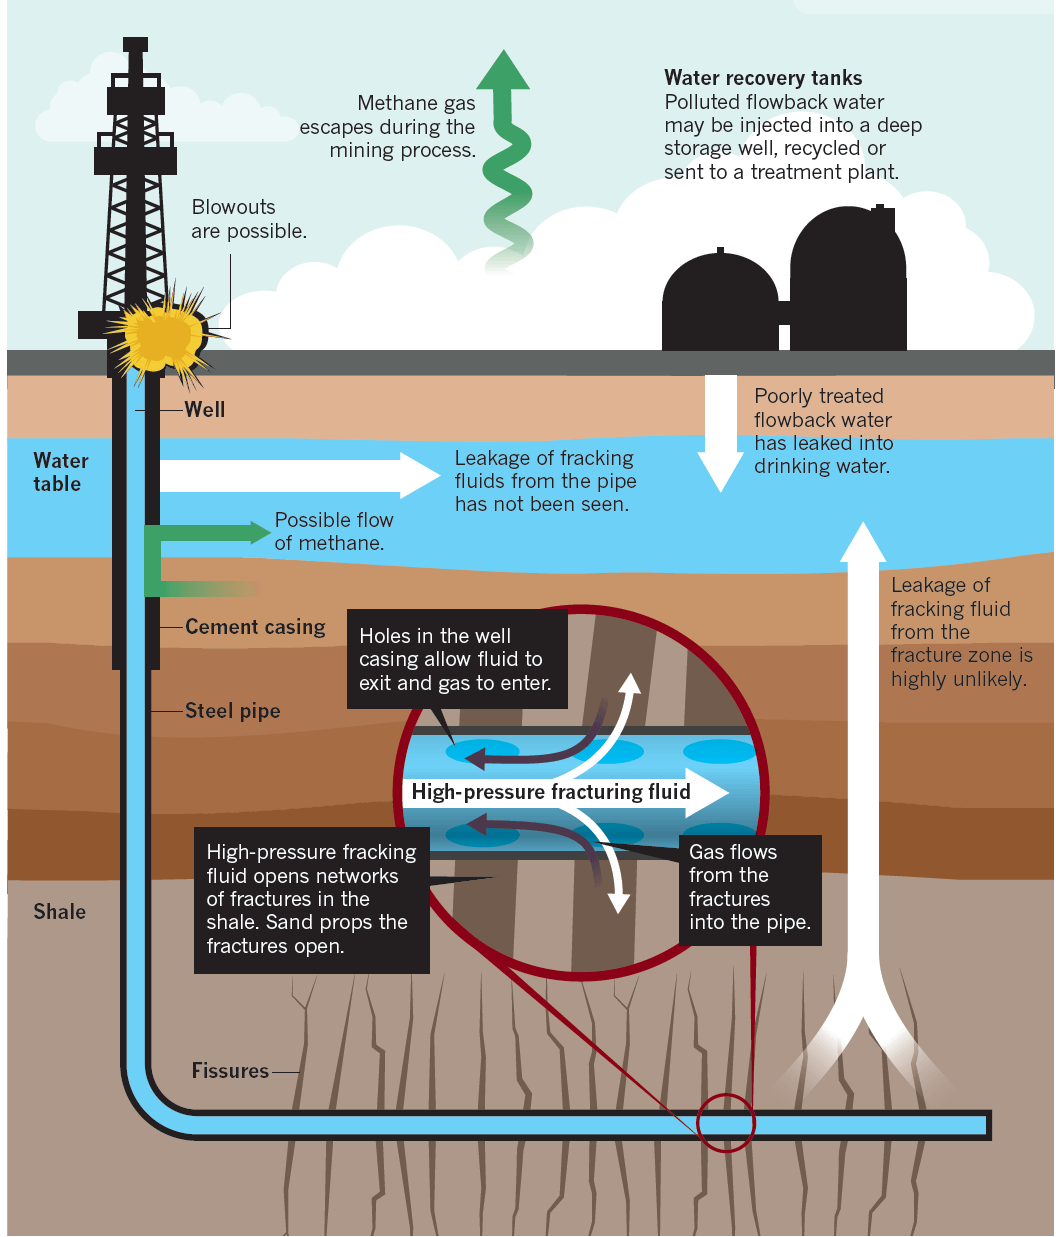
- Extraction is done through horizontal drilling through the shale seam, followed by hydraulic fracturing, or fracking, of the rock by the injecting fluid at extremely high pressure.

Hydro-fracturing or Fracking
- Shale rock is sometimes found 3,000 metres below the surface.
- After deep vertical drilling, there are techniques to drill horizontally for considerable distances in various directions to extract the gas-rich shale.
- A mixture of water, chemicals, and sand is then injected into the well at very high pressures to create a number of fissures in the rock to release the gas.
- The process of using water for breaking up the rock is known as ‘hydro-fracturing’ or ‘fracking’.
- The chemicals help in water and gas flow and tiny particles of sand enter the fissures to keep them open and allow the gas to flow to the surface.

Guar gum
- Guar gum can quickly turn water into a very thick gel.
- Adding guar gum increases viscosity of water and makes high-pressure pumping and the fracturing process more efficient.
- High viscosity water is much more effective at suspending sand grains and carrying them into the fractures.
- The guar been is grown mainly by farmers in Rajasthan and Haryana.
- Earlier, guar gum was used mainly as an additive in ice creams and sauces.
- But with the discovery of its use in shale gas extraction, its price shot up enormously.
Problems associated with shale gas exploitation
- Environmentalists have objected to fracking because of the damage to forest cover and possible contamination of ground water.
- However, industry officials say that the treated water can be re-used for further fracking and need not be disposed of at all.
Shale Gas Reserves across India and the World
Recoverable Shale Gas Resources by Country
| Country | Shale gas reserves (in TCF) | Technically recoverable Shale gas reserves (in TCF) |
|
1275 | 1,115 |
|
862 | 623 |
|
774 | 802 |
|
681 | 545 |
|
485 | 390 |
| India | 100-200 TCF | World Total 7576 |
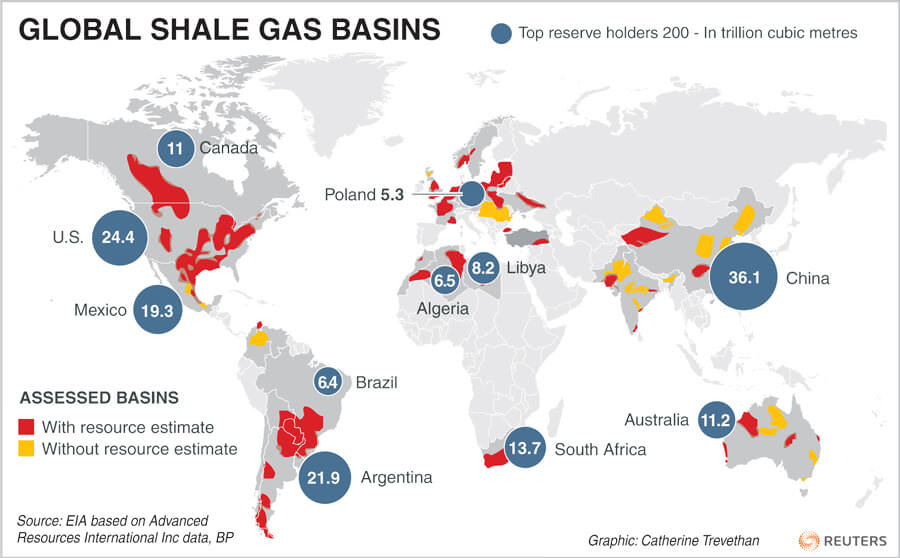

- Till 2000, there has been almost nil shale gas production in the United States, but now it is the pioneer country in shale gas production.
- China has the largest reserves, yet the production is low.
- In India, probable Shale gas resources are in the range of 100-200 TCF in 5 Indian sedimentary basins.
- ONGC predicts 187.5 TCF of shale gas in Cambay Onland, Ganga Valley, Assam & Assam-Arakan, Krishna Godavari (KG) Onland, Cauvery Onland & Rajasthan & Vindhya Basins.
- Indian engineers have gathered experience on fracking by spending time in the US and are now able to hunt for the scarce resource on their own.


Shale Gas Extraction Issues in India – If US can then why can’t India?
- India suffers from water scarcity whereas the U.S. do not have the same water worries.
- In the US, the natural gas department is exempt from scrutiny for chemical injection in the ground (companies need not disclose the chemicals used during hydraulic fracturing). There is no such legislation in India.
- In US, the citizen or resident owns the resources that lie beneath the ground. In India, soil below the land is a public property and the companies must follow all the necessary rules to acquire it.
- The US has mapped all its shale reserves. In India there is no clarity on the exact recoverable shale reserves.
- The population density is much lower in the US and they can afford to do it.
- Government-issued leases for conventional petroleum exploration do not include unconventional sources such as shale gas.
- All locations in US is well connected with gas pipelines. Bulk of the reserves in eastern India lack the necessary network of pipelines to transport the gas.
Shale Gas: Low Potential, High Risk and India has a Better Alternative
- India has 315 billion tonnes of coal lying under its soil.
- Extraction is complicated because of environmental issues.
- But, ‘underground coal gasification’, can create 6,900 TCF of gas which is way higher than shale reserves.
- India’s shale resources at a more modest 100-200 TCF. On the other hand, India’s CBM potential is estimated at 450 TCF (91 TCF proven reserves).
- Coal bed methane (CBM), in terms of depth, occurs much closer to the land surface than shale gas and hence it is comparatively easier to extract.
- So, focus must be on CBM exploration rather than on risky shale business.
Mains 2013: It is said that India has substantial reserves of shale oil and gas, which can feed the needs of the country. However, tapping of resourced does not appear to be high on the agenda. Discuss critically the availability and issues involved. (10 marks – 200 words)
Answer Yourself with the help of above points.
Tight Gas
- Tight gas is natural gas produced from reservoir rocks of low permeability.
- Just like shale gas, it has to be extracted by massive hydraulic fracturing.
- The difference between shale gas and tight gas is that, shale is trapped in sedimentary shale rocks whereas tight gas is found trapped in sandstone or limestone formations with relatively low permeability.
- Few countries like USA, Canada, China and Australia are the pioneers in the development of tight reservoirs.
- Tight reservoirs occur in almost all the producing basins of India and in frontier basins viz. Bengal & Vindhyan basin.
- Exploration of tight reservoir has already started in KG-PG, Cauvery and Cambay basins
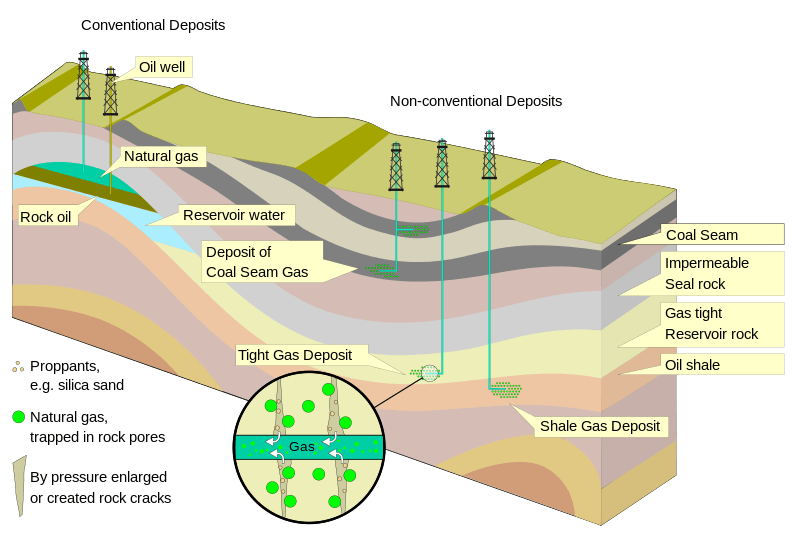

Image credits: Wikipedia
Bauxite
- Bauxite ore is the primary source of aluminium.
- It forms when laterite soils are severely leached of soluble materials in a wet tropical or subtropical climate.
- The ore is chemically processed to produce aluminium oxide.
- Aluminium oxide is then smelted using electrolysis to produce aluminium metal.
Bauxite Distribution in India
- Reserves of bauxite in India as of 2015, have been placed at 3.9 BT (77% metallurgical grade).
| Bauxite Reserves in India | Bauxite Production in India | |||
| State | % share | State | Production (MT) 2017-18 | |
|
51% |
|
7.8 | 52% |
|
16% |
|
2.1 | 14% |
|
9% |
|
2 | 13.3% |
|
6% |
|
1.6 | 10.7% |
| Total | 3.9 BT | Total | 15 MT | |
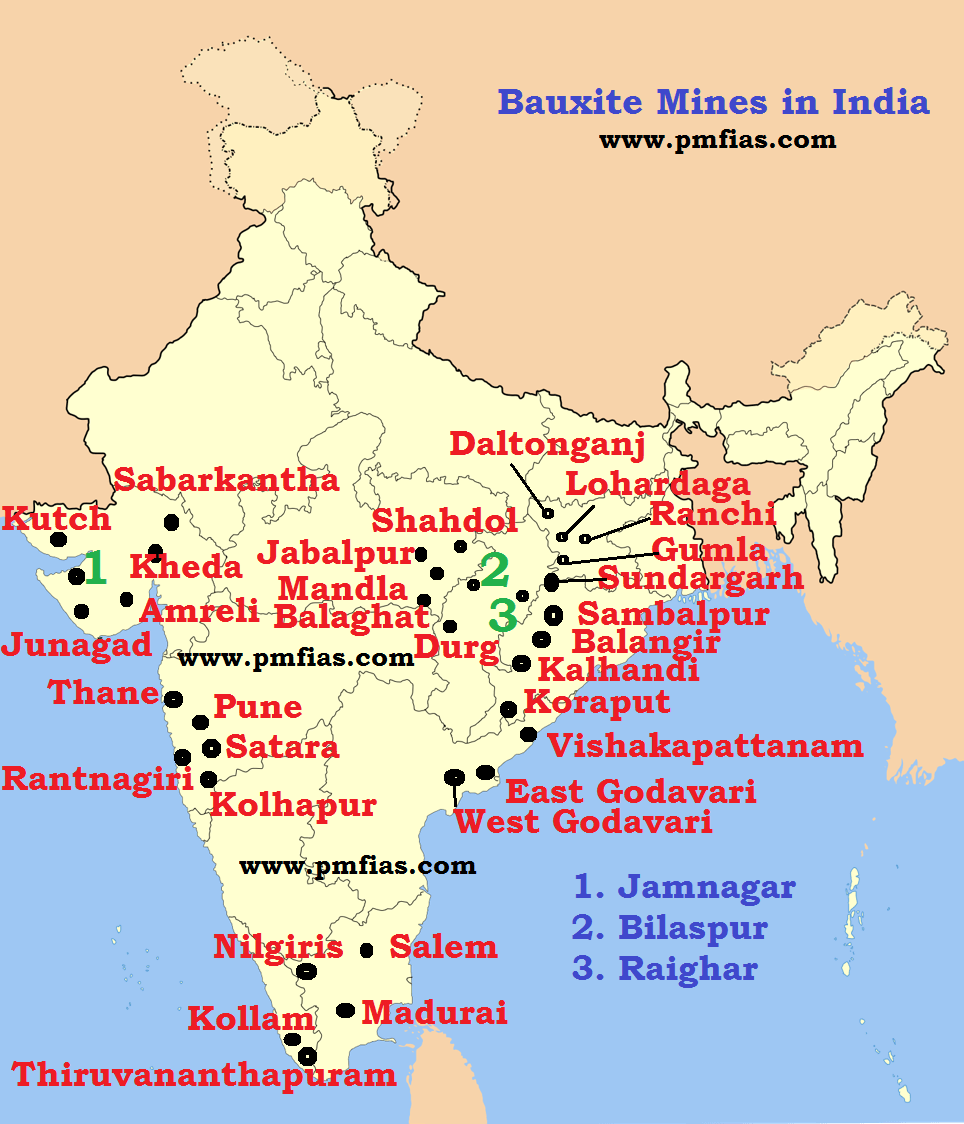

| Odisha |
|
| Chhattisgarh |
|
| Maharashtra |
|
| Jharkhand |
|
| Gujarat |
|
| Madhya Pradesh |
|
| Tamil Nadu |
|
Bauxite Distribution across the World
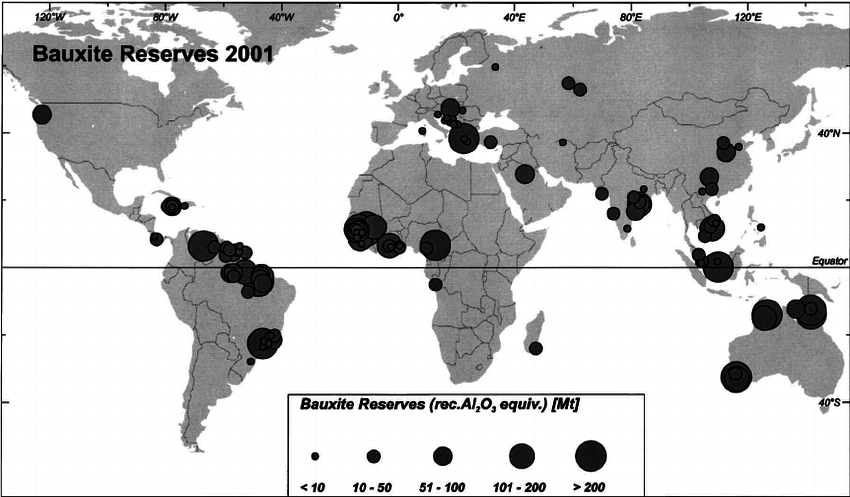

World’s Bauxite Reserves: Source and Credits
| World’s Bauxite Reserves | World’s Bauxite Production | ||
| Country | Reserves (BT) | Country | Production (MT) |
|
7.4 |
|
89 |
|
6 |
|
65 |
|
3.7 |
|
47 |
|
2.6 |
|
38 |
| Total | ~ 30 BT |
|
15 |
|
|||
Lead & Zinc
Lead
- Lead is a corrosion-resistant, ductile (can be drawn out into a thin wire) and malleable (can be hammered into shape without breaking) blue-grey metal. It is a bad conductor.
- It is a heavy metal that is denser than most common metals and also has a relatively low melting point.
- Galena (lead glance – natural mineral form of lead sulphide), a principal ore of lead, often bears silver.
- Galena is found in veins in limestones, calcareous slates and sandstones.
- Lead is easily extracted from its ores.
- Lead effectively resists corrosive effects of atmospheric gases and acidic substances.
- Hence it is largely used for coating iron-sheets, lining acid tanks etc.
- World-wide largest single use of lead today is in the manufacture of lead-acid storage batteries.
- Other major uses of lead are in the manufacture of storage batteries, paints, ammunition, etc.
- It is alloyed with many other metals to produce brass, bronze (anti-friction metal), etc.
- It is also used as plumbing material in automobiles, aero planes, electric wires, etc.
Zinc
- Zinc is a silvery blue-grey metal with a relatively low melting and boiling point.
- Sphalerite (zinc sulphide) is the principal ore of zinc.
- It is usually found in veins in association with galena, pyrite (iron disulphide), and other sulphides.
- About three-fourths of zinc is used as coating to protect iron and steel from corrosion (galvanized steel) and as alloying metal to make bronze and brass.
- The remaining one-fourth is consumed as zinc compounds mainly by the rubber, chemical, paint, and agricultural industries.
- Zinc is also a necessary element for proper growth and development of humans, animals, and plants.
- It is the second most common trace metal, after iron, naturally found in the human body.
Distribution of Lead and Zinc ores – India and World
| World’s Lead Reserves (in MT) | World’s Lead Production (in thousand tons) | World’s Zinc Reserves (in MT) | World’s Zinc Production (in thousand tons) | ||||
| Country | Reserves | Country | Year 2017 | Country | Reserves | Country | Year 2017 |
|
24 |
|
2300 |
|
64 |
|
4300 |
|
18 |
|
459 |
|
44 |
|
1473 |
|
6.4 |
|
307 |
|
21 |
|
841 |
| World Total | 83 MT | India | 173 | World | 230 MT |
|
784 |
- Indian has 2.5 MT of lead and 10 MT of zinc reserves.
- Both lead & zinc are found to occur together in ore along with other metals like silver and cadmium.
- The country has the self-sufficiency in respect of zinc. In contrast, there is short supply of lead.
- Almost the entire production of zinc and lead comes from Rajasthan.
- The demand for lead from Lead Acid Battery Sector is met by the thriving market of lead scrap recycling.
- Hindustan Zinc Ltd (Rajasthan) is the only producer of primary lead and primary zinc in 2017-18.
- Edayar (Binani) Zinc Limited did not operate pursuant to repealing of Sick Industrial Companies.
| State | Reserves (MT) | Major Mines in Rajasthan | |
|
670 | 89% |
|
|
22.7 | 3% | |
|
14.8 | 2% | |
|
11.4 | 1.5% | |
|
9.3 | 1.24% | |

Pyrites
- Sulphur is used for the production of sulphuric acid which in turn is used for the production of chemical fertilizers, textiles, galvanising of steel, storage batteries, refining of petroleum, explosives and other acids.
- Elemental sulphur is useful for manufacturing explosives, matches, insecticides and for vulcanizing rubber.
- It can be found as a pure element or as sulphate or sulphide minerals.
- Pyrite is a sulphide of iron that occurs in sedimentary rocks. It is a chief source of sulphur.
- Sulphide occurs naturally in mineral ores, oil and coal deposits.
- Native sulphur deposit has been reported in Puga Valley of Leh district in Jammu & Kashmir.
- Petroleum refineries extract H2S when making “clean fuels” and use it as a feed stock to produce sulphur.
- High proportion of sulphur is injurious to iron. Hence is it removed and used to produce sulphur.
- Total reserves of pyrites in the country as of 2015 have been placed at 1.7 BT.
- Out of these, only about 27 million tonnes are under feasibility category.
- Major reserves are located in Bihar (94%) and Rajasthan (5%).
- Entire native resources of sulphur are located in Jammu & Kashmir (100%) and are placed at 0.21 MT.
- China, USA and Canada have the highest reserves.
- India’s imports of sulphur were mainly from UAE (30%), Qatar (28%), Saudi Arabia (22%).
Gold and Silver
Gold
- Gold in its purest form is dense, soft malleable and ductile metal.
- It is one of the least reactive chemical elements (resistant to corrosion).
- Gold often occurs in free elemental (native) form, as nuggets or grains, in auriferous (rocks containing gold) rocks, in vein, and in alluvial deposits.
Gold Reserves and Production in India
- As of 2015, the total reserves of gold ore in the country have been estimated at 502 MT.
- The total reserves of gold (primary), in terms of metal stood at 655 Tons.
| India’s Gold Ore reserves | India’s Gold Production | |||
| State | % Share | In terms of Metal Content | State | FY 2017-18 |
|
44% |
|
|
99% |
|
25% |
|
|
1% |
|
21% |
|
The domestic production nowhere meets the domestic demand. The demand is mainly met through imports. | |
|
3% |
|
||
|
3% |
|
||
|
2% | Total: 655 Tons | Total | 550 TT |
| Karnataka |
|
|||
| Jharkhand |
|
|||
| Andhra Pradesh |
|
|||
| Kerala |
|
|||


World’s Gold Reserves and Gold Production
| World’s Gold Reserves (in MT) | World’s Production of Gold in 2017 (in TT) | ||||
| Country | Reserves | Country | Production | Major gold mines | |
|
9.8 |
|
426 | 13% |
|
|
6 |
|
294 | 9% | |
|
5.3 |
|
270 | 8% | |
|
3 |
|
237 | 7% | |
|
2.6 |
|
176 | 5% | |
|
2.5 |
|
151 | 5% | |
|
2.4 |
|
137 | 4% | |
|
2 |
|
137 | 4% | |
|
2 |
|
127 | 4% | |
| World Total | 54 MT | World Total | 3.3 MT | ||
Silver
- Silver is grouped in the category of noble metals (highly resistant to corrosion; e.g. gold, platinum, etc.).
- Silver is known to have the highest electrical and thermal conductivity amongst all metals.
- It is used in printed electric circuits, coating (electroplating) for electronic conductors and in alloys of gold & copper for electrical contacts.
- Its chloride and iodide are light-sensitive and hence used in photographic material.
- Silver (in paste form) is used on solar cells.
- The chief ore minerals of silver are stephanite, pyrargyrite and proustite.
Silver Reserves and Production – India & World
- In India, there are no native silver deposits except the small Bharak deposit in Rajasthan.
- Silver occurs generally with lead, zinc, copper (especially their sulphide ore) and gold ores and is extracted as a by-product from electrolysis or chemical methods.
- Silver was recovered in the past as a co-product in gold refining at KGF and Hutti Gold Mines in Karnataka.
- Silver is now recovered as a by-product from Hindustan Zinc Smelter, Chanderiya, Chittorgarh in Rajasthan, Tundoo smelter in Jharkhand and Visakhapatnam smelter in AP and from gold refinery of Hutti.
- The Hindustan Copper Ltd. at Maubhandar smelter in Singhbhum district of Jhakhand obtains silver from copper slimes.
- The total reserves of silver in India as of 2015 have been estimated at about 511.95 MT.
- The total reserves of silver in terms of metal were estimated at 29,982 tonnes.
- Rajasthan accounts for 87% reserves in terms of ore, Jharkhand 5%, Andhra Pradesh 3% and Karnataka 2%.
- Indian produced ~557.7 Tons of silver in 2017-18 of which Rajasthan alone accounted for ~557 tons. The rest came from Karnataka.
| World’s Silver Reserves (in TT) | World’s Production of Silver in 2017 (in TT) |
|
||
| Country | Reserves | Country | Production | |
|
110 |
|
5.8 | |
|
110 |
|
4.3 | |
|
89 |
|
3.5 | |
| World Total | 560 | India | 0.5 TT | |
Ores of Metals used in Alloys
Manganese
- Manganese is very hard and brittle in nature.
- It is always available in combination with iron, laterite and other minerals.
- Manganese ores of major commercial importance are pyrolusite, psilomelane, manganite & braunite.
- Manganese is added to steel to increase its strength.
- Manganese in aluminium alloy cans improves the resistance to corrosion.
- Iron & Steel Industry is the major consumer of manganese ore wherein manganese ore is used directly as a blast furnace feed (manganese deoxidizes and desulfurizes steel).
- Most of the manganese goes into the production of manganese alloys such as ferromanganese.
Manganese ore distribution in India
- Indian manganese ore deposits occur mainly as metamorphosed sedimentary deposits.
- Gondite deposits: Madhya Pradesh (Balaghat & Chhindwara districts), Maharashtra (Bhandara & Nagpur districts), Gujarat (Panchmahal district) and Odisha (Sundargarh district).
- Kodurite & Khondolite deposits: Odisha (Koraput district) and Andhra Pradesh (Srikakulam district).
| India’s Manganese Ore Reserves as of 2015 have been placed at 496 MT | India’s Manganese Ore Production 2017-18 in TT | ||
| State | % Share | State | Production |
| Odisha | 44% | Madhya Pradesh | 831 |
| Karnataka | 22% | Maharashtra | 731 |
| Madhya Pradesh | 12% | Odisha | 517 |
| Maharashtra | 7% | Karnataka | 294 |
| Goa | 7% | Andhra Pradesh | 167 |
| Andhra Pradesh | 4% | Total | 2.6 MT |
- Presently India is one of the major importers of manganese ore in the world.
- Imports of manganese ore stood at 3.57 MT.
- South Africa (58%), Australia (14%) and Gabon (13%) were the main suppliers of manganese ore in 2017-18.


Manganese ore distribution across the World
| World’s Manganese Ore Reserves in MT | World’s Manganese Ore Production in MT | ||
| Country | Reserves | Country | Production |
|
230 |
|
13.8 |
|
140 |
|
12.5 |
|
110 |
|
6 |
|
99 |
|
4 |
| India | 33 |
|
3 |
| World Total | 760 MT |
|
2.5 |
Tungsten
- Tungsten (wolfram) is a rare metal found naturally on Earth combined with other elements.
- It is a hard steel-grey shiny metal that is often brittle and hard to work.
- Its important ores include wolframite and scheelite.
- Tungsten has the highest melting point (3422 °C) among elements.
- It also has the highest boiling point (5930 °C).
- Its density is comparable to that of uranium and gold, and much higher than that of lead.
- Much of the wolfram is used by the steel industry (it imparts self-hardening property to steel).
- It is elastic, ductile and has high tensile strength and can be drawn into very thin wires.
- Tungsten is easily alloyed with chromium, nickel, molybdenum, titanium, etc. to yield a number of hard facing, heat and corrosion resistant alloys (resistant to all acids).
- Tungsten carbide is used in cemented carbides (hardmetals) which are wear-resistant materials used by the metalworking and mining industries.
- Tungsten’s hardness and high density give it military applications in penetrating projectiles.
- Tungsten is also used to make heavy metal alloys for armaments, high-density applications, such as superalloys for turbine blades.
- Tungsten’s many alloys have numerous applications, including incandescent light bulb filaments, X-ray tubes, electrodes in gas tungsten arc welding, superalloys, and radiation shielding.
Distribution of Wolfram in India and across the World
| World’s Tungsten Reserves (in MT) | World’s Tungsten Production (in MT) | India’s Tungsten Reserves | ||||
| Country | Reserves | Country | Production | State | Share | Regions |
|
1900 |
|
65 | Karnataka | 42% | Kolar Gold Fields |
|
240 |
|
6.4 | Rajasthan | 27% | Degana in Nagaur district |
| World Total | 3300 MT |
|
2 | Andhra Pradesh | 17% | East Godavari district |
| Indian has total reserves of 87.39 MT of tungsten | Maharashtra | 9% | Sakoli basin in Nagpur district | |||
- The domestic requirements of tungsten and its products are met mainly through imports from China, Austria, Korean Republic, etc.
Copper
- Copper is one of the few metals that occurs in nature in directly usable metallic form (native metals).Copper is a malleable and ductile metal with very high thermal and electrical conductivity.
- Copper and its alloys are widely used in electrical industry.
- Pure gold is 24 carat gold. This is alloyed with 2 parts of silver or copper to make it hard (22 carat gold).
Major Copper AlloysIron + Nickel + Copper + Chromite + …. 🡺 Stainless Steel Copper + Nickel 🡺 Morel Metal Copper + Aluminium 🡺 Duralumin Copper + Zinc 🡺 Brass Copper + Tin 🡺 Bronze |
Copper Ore Distribution and Production in India
- Hindustan Copper Limited (HCL), a PSU, is the only integrated company in the country that is involved in mining & beneficiation of ore and is engaged in smelting, refining and casting of refined copper.


| Copper ore reserves in India | ||||||
| State | Ore Reserves (MT) | Metal Reserves (MT) | Major districts with ore reserves | |||
|
813 | 54% | 4.5 | Jhunjhunu (Khetri-Singhana) | ||
|
295 | 19.5% | 3.2 | Singhbhum | ||
|
283 | 18.8% | 3.4 | Balaghat (Malanjkhand copper mines) | ||
| Total | 1.51 BT | 12.1 MT | ||||
| Copper Ore and Coper Metal production in India in 2017-18 | ||||||
| State | Copper Ore Production (MT) | Copper Metal Production (TT) | ||||
| Madhya Pradesh | 2.3 | 20 | ||||
| Rajasthan | 1.1 | 11.2 | ||||
| Jharkhand | 0.18 | 1.5 | ||||
| Total | 3.68 MT | 33 TT | ||||
- The copper ores contain a small percentage of the metal and hence mining is expensive.
- The total reserves of copper ore in India as of 2015 are estimated at 1.51 billion tonnes.
- The total metal content out of the total resources is a mere12.16 million tonnes (low grade copper ore).
- Hence India imports most of its copper.
Distribution of Copper Ore and Production Across the World
- The world mine production of copper was at 20.2 million tonnes of metal content in 2017.


| World’s Copper Reserves in MT | World’s Copper Production in MT | ||
| Country | Reserves | Country | 2017 |
|
170 | Chile | 5.5 |
|
88 | Peru | 2.4 |
|
83 | China | 1.7 |
| World Total | 830 MT | USA | 1.3 |
Nickel
- Nickel does not occur free in nature. It is found in association with copper, uranium and other metals.
- It has relatively low electrical conductivity, high resistance to corrosion, excellent strength at high temperatures and capable of getting magnetised.
- Hence nickel steel is used for manufacturing armoured plates, bullet jackets etc.
- Nickel is an important alloying material.
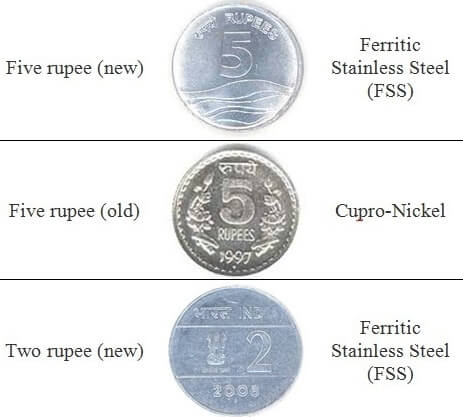
Iron + Nickel 🡺 Stainless Steel
Nickel + Copper or Silver 🡺 Rupee Coins


- Nickel-aluminium alloys are used for manufacturing aeroplanes and internal combustion engines.
- Metallic nickel is used for making batteries and as a catalyst for hydrogenation or hardening of fats and oils intended for use in soap and foodstuffs.
Distribution of Nickel in India and World
- Nickel occurs principally as oxides, sulphides and silicates in India.
- Important occurrence is in Sukinda Valley, Jajpur district, Odisha, where it occurs as oxide.
- Nickel also occurs in sulphide form along with copper in East Singhbhum district, Jharkhand.
- In addition, it is found associated with uranium deposits at Jaduguda, Jharkhand.
- Other important occurrences of nickel are in Karnataka, Kerala and Rajasthan.
- Polymetallic sea nodules are another source of nickel.
| India’s Nickel Ore Reserves in MT | World’s Nickel Metal Reserves in MT | World’s Nickel Metal Production in 2017 in TT | Imports in 2016-17 in Tons | |||||
| State | Reserves | Country | Reserves | Country | Reserves | Country | Qty | |
|
175 | 93% | Indonesia | 21 |
|
339 | Guinea | 796 |
|
9 | 4.7% | Australia | 19 |
|
315 | Australia | 264 |
|
5 | 2.6% | Brazil | 11 |
|
221 | Total | 1062 T |
| Total | 189 MT | World Total | 89 MT | |||||
Molybdenum
- Molybdenum is used as an alloying agent in steel, cast iron, nickel, cobalt, titanium & superalloys to enhance strength and resistivity to wear & corrosion.
- As a refractory metal, it is used in many electrical and electronic components.
- Molybdenum plays a vital role in the energy industry and it may become essential in green technology.
- Molybdenum does not occur freely in nature.
- Molybdenite is the principal ore of molybdenum.
- In India, molybdenum is associated generally with copper, lead and zinc ores.
- In India, molybdenum is produced intermittently from uranium ore of Jaduguda mine in Jharkhand.
- There are several critical minerals that India lacks and one of them is molybdenum.
| India’s Molybdenum Reserves in MT | World’s Molybdenum Reserves in MT | World’s Molybdenum Production in 2017 in TT | |||
| State | Reserves | Country | Reserves | Country | Production |
|
10 |
|
8300 |
|
130 |
|
8 |
|
2700 |
|
62 |
|
1.32 |
|
2400 |
|
44 |
| Total | 19.4 MT | World Total | 17000 |
|
28 |
- The reserves of molybdenum ore in India have been estimated at 19.4 MT containing about 12.7 TT of Molybdenum disulphide.
- Imports of molybdenum ores stood at 9 TT in 2017-18.
- Imports were mainly from Chile (36%), Thailand (24%), USA (9%).
Chromite
- Chromite (iron chromium oxide) is the commercially viable ore of chromium.
- The chromium extracted from chromite is used in chrome plating and alloying for production of corrosion resistant super alloys, nichrome, and stainless steel.
- It is also used in the manufacture of alloys along with other metals, such as nickel, cobalt, molybdenum, copper, titanium, zirconium, vanadium, selenium, etc.
Chromite Distribution across India and World
- The total reserves of chromite in India as of 2015 is estimated at 344 MT.
- More than 96% resources of chromite are located in Odisha (Jajpur, Kendujhar and Dhenkanal districts).
- Minor deposits are scattered over Manipur, Nagaland, Karnataka, etc.
- The production of chromite was 3.4 MT during 2017. Odisha alone produced 3.3 MT (rest from Karnataka).
- Imports of chrome ore were mainly from South Africa (99%).
| World’s Chromium Metal Reserves in MT | World’s Chromite Production in MT | ||
| Country | Reserves | Country | 2017 |
|
230 |
|
16.5 |
|
200 |
|
6.6 |
|
100 |
|
6.3 |
| World Total | 560 |
|
3.4 |
Cobalt
- Cobalt is an important ferromagnetic alloying metal having irreplaceable industrial applications.
- Cobalt is extracted as a by-product of copper, nickel, zinc or precious metals.
- Major use of cobalt is in metallurgical applications, in special alloy/super alloy industry.
- Super alloys made of cobalt are wear & corrosion-resistant at elevated temperatures.
- Hard-facing or cutting tools with cobalt alloys provide greater resistance to wear, heat, and corrosion.
- Cobalt is used as precursors (cobalt compounds) for cathodes in rechargeable batteries.
- Largest demand for cobalt has been from the Rechargeable Battery Industry (Lithium ion battery).
- Cobalt is alloyed with aluminium and nickel to manufacture powerful magnets.
Distribution of Cobalt Reserves across India and the World
| State | Reserves in MT | Region with reserves | |
|
31 | 69% | Kendujhar and Jajpur districts |
|
9 | 20% | Singhbhum district |
|
5 | 11% | Tuensang district |
| Total | 44.9 MT | Presently, there is no production of cobalt from primary cobalt resources. | |
|
|||
- The demand for cobalt is usually met through imports.
- Recycling technologies for recovery of cobalt from waste Li-ion batteries have been an evolving process.
- Imports of cobalt and alloys were at 875 tonnes in 2017-18.
- Imports were mainly from USA & Canada (13% each), Belgium (12%), Norway & UK (9% each) and China (8%) & Morocco (7%).
| World’s Reserves of Cobalt Content (in TT) | World’s Production of Cobalt Content in 2017 (in TT) | ||||
| Country | Reserves | Country | Production | ||
| Congo (Kinshasa) | 3400 | 49% | Congo | 82.5 | 59% |
| Australia | 1200 | 17% | New Caledonia | 9.4 | 7% |
| Cuba | 500 | 7% | China | 9 | 6% |
| Philippines | 280 | 4% | Canada | 6.5 | 5% |
| Canada | 250 | 4% | Australia | 5.2 | 4% |
| World Total | 6900 TT | Total | 139 TT | ||
Strategic Minerals
Lithium
It’s used in the manufacture of aircraft and in certain batteries.
- Lithium is lightest known metal. It has a density of 0.534 g/cm3 (half as dense as water).
- It’s light and soft and has lowest melting points of all metals and a high boiling point.
- Lithium-ion batteries are key to lightweight, rechargeable power for laptops, phones, electric vehicles, etc.
- Lithium and another battery component, cobalt, could become scarce as demand increases
- Lithium is highly reactive and flammable and must be stored in mineral oil.
- It never occurs freely in nature, but only in compounds such as igneous rocks formed underground.
- China controls most of the lithium supply across the world.
| World’s Lithium Reserves in MT | World’s Lithium Production in TT | ||||
| Country | Reserves | Country | Production | ||
| Chile | 7.5 | 47% | Australia | 18.7 | 43% |
| China | 3.2 | 20% | Chile | 14.1 | 33% |
| Australia | 2.7 | 17% | Argentina | 5.5 | 13% |
| Argentina | 2 | 13% | China | 3 | 7% |
| World total | 16 MT | World total | 43 TT | ||
KABIL Set up to Ensure Supply of Critical Minerals
PIB | 01-08-2019
- A joint venture company namely Khanij Bidesh India Ltd. (KABIL) is to be set up with the participation of three Central Public Sector Enterprises namely,
- National Aluminium Company Ltd. (NALCO),
- Hindustan Copper Ltd. (HCL) and
- Mineral Exploration Company Ltd. (MECL).
- The equity participation between NALCO, HCL and MECL is in the ratio of 40:30:30.
- Objective of constituting KABIL is to ensure a consistent supply of critical and strategic minerals to Indian domestic market.
KABIL functions
- The KABIL would carry out identification, exploration, development, mining and processing of strategic minerals overseas for commercial use and meeting country’s requirement of these minerals.
- The new company will help in building partnerships with other mineral rich countries like Australia and those in Africa and South America.
The Need for KABIL
- Indian is betting big on Electric Vehicle Mobility therefore it is important to ensure energy storage through batteries.
- Aviation, Defence and Space Research also require minerals with lower weight and high mechanical strength.
- Among such twelve minerals identified as strategic minerals, which have meagre resource base, Lithium and Cobalt are significant.
There are more strategic minerals that are scare but are indispensable for India. They will be covered under “current affairs” whenever they are in news
Non Metallic: Graphite and Diamond
Graphite
- Graphite, also known as plumbago or black lead, is the most stable form of carbon.
- It is extremely soft (greasy feel), cleaves (splits into layers) with very light pressure.
- It is extremely resistant to heat and is highly unreactive.
- Graphite is the only non-metal that can conduct electricity.
- The carbon content in Graphite is high (more than that in anthracite coal).
- Graphite may be considered the highest grade of coal, just above anthracite.
Carbon content in Peat < Lignite < Bituminous < Anthracite < Graphite < Diamond
- It is not normally used as fuel because it is difficult to ignite.
- Most of the graphite is formed at convergent plate boundaries where organic-rich shales and limestones were subjected to metamorphism due to heat and pressure.
- Graphite formed from the metamorphism of coal seams is known as amorphous graphite.
- Both crystalline and amorphous varieties of graphite are produced in India.
- Synthetic graphite is manufactured in electric furnaces, using anthracite as raw feed.
Applications of Graphite
- Natural graphite is mostly consumed for refractories, batteries, steelmaking, lubricants etc.
- A refractory material is one that retains its strength at high temperatures.
- Natural and synthetic graphite are used to construct the anode of all major battery technologies.
- Natural amorphous graphite is used in brake linings for heavier vehicles.
- Graphite lubricants are used at very high or very low temperatures.
- Modern pencil lead is most commonly a mix of powdered graphite and clay.
Distribution of Graphite across India and World
| Total resources of Graphite in India in MT | Total recoverable resources of Graphite in India in MT | ||||
| State | Resources | State | Recoverable Resources | ||
|
72 | 37% |
|
4.2 | 52% |
|
62 | 32% |
|
3.4 | 42% |
|
19 | 9.7% |
|
0.5 | 6% |
|
17 | 9% | Total | 8 MT | |
|
7.9 | 4% |
|
||
|
5.7 | 2.9% | |||
| Total | 195 MT | ||||
- Graphite mines, barring a few underground mines are mostly small and opencast.
- Active mining centres of graphite are in Palamu district in Jharkhand; Nuapada & Balangir districts in Odisha; and Madurai & Sivaganga districts in Tamil Nadu.
| World’s Graphite (natural) Reserves in MT | World’s Graphite (natural) Production in TT |
|
||
| Country | Reserves | Country | Production | |
|
90 |
|
900 (88%) | |
|
73 |
|
82 (8%) | |
|
72 |
|
34 (3%) | |
| India | 8 |
|
30 | |
| World Total | 300 | Total | 1 MT | |
Diamonds
- Diamond is the hardest naturally occurring substance found on Earth. Its composition is pure carbon.
- Diamonds are formed in mantle (formed from carbon under very high temperatures and pressures).
- They are brought to the earth’s crust due to volcanism.
- Most of the diamonds occur in kimberlite pipes, dykes, sill etc. (volcanic igneous rock landforms).
- Diamonds, derived from the primary sources, occur in alluvial deposits also.
- Diamonds are used in ornaments and as abrasive material (polishing metal surfaces) and in gem cutting.
- The important industrial use of diamonds is in cutting-edges of drills used for exploration and mining.
- Synthetic diamonds compete as an abrasive mineral with natural industrial diamonds.
Distribution of Diamond Bearing rocks and gravels in India
- Andhra Pradesh: Anantapur (Wajrakarur Kimberlite pipe), Kadapa, Guntur districts;
- Madhya Pradesh: Panna belt;
- Chhattisgarh: Raipur and Bastar districts; and
- Odisha: region lying between Mahanadi and Godavari valleys.
- The new kimberlite fields were discovered in Raichur-Gulbarga districts of Karnataka.
| India’s Diamond Reserves in Million Carats | India’s Diamond Production in 2017 in Thousand Carats | |||
| State | Reserves | State | Production | |
|
28.7 | 90% | Madhya Pradesh | 39.7 |
|
1.8 | 5.7% | 100% of India’s Diamond Production happens in Majhgawan, Satna District, Madhya Pradesh. | |
|
1.3 | 4% | ||
| Total | 31.83 million carats | |||
- India depends almost entirely on imports of rough gem diamonds for its Cutting and Polishing Industry.
- Workmanship of Indian artisans at polishing small diamonds economically has been widely acknowledged.
- Most of the world’s diamond cutting and polishing is done in Surat, Gujarat.
- In 2017-18, imports value of diamonds was 1,90,203 crores.
- Imports were mainly from Unspecified countries! (27%), UAE (15%), Belgium (14%), Russia (12%), etc.
- Value of diamond exports stood at 1,62,022 crores in 2017-18.
- Exports were mainly to Hong Kong (40%), USA (30%), Belgium (9%), etc.
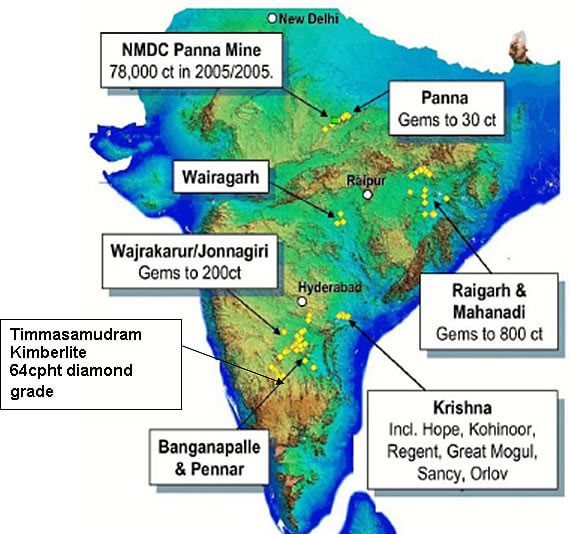

Diamonds Across the World
| World’s Diamond Reserves in Million Carats | World’s Diamond Production in Million Carats |
|
||
| Country | Reserves | Country | Production | |
|
650 |
|
42.6 | |
|
150 |
|
22.9 | |
|
120 |
|
22.7 | |
|
90 |
|
17.1 | |
|
70 |
|
15.4 | |
| World Total | 1200 |
|
9.7 | |


Differences Between Graphite and Diamond
- Graphite & Diamond are the major allotropes of carbon. Other important allotrope being anthracite coal.
Allotrope: two or more different physical forms in which an element can exist (e.g. graphite, charcoal, and diamond as forms of carbon).
- Graphite and diamond share the same composition but have very different structures.
| Graphite | Diamond |
|
|
|
|
|
|
|
|
Non Metallic: Limestone, Dolomite and Magnesite
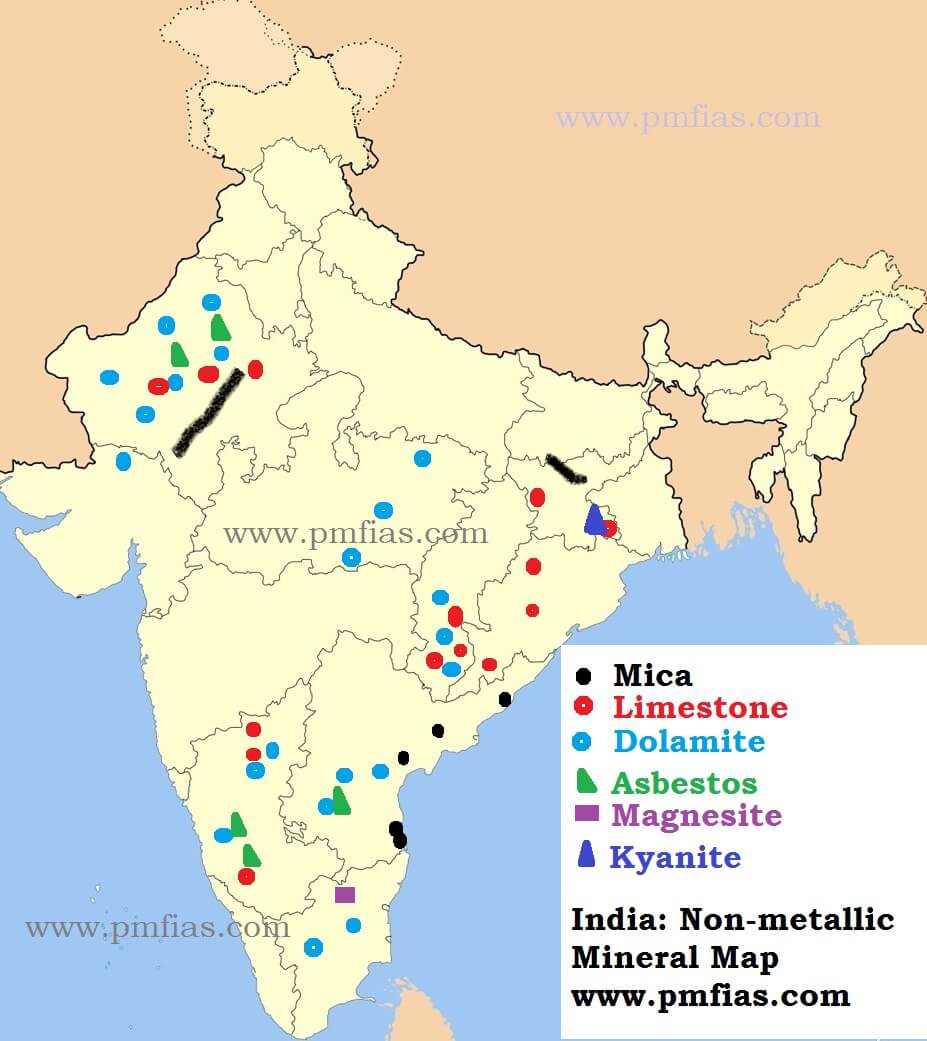

Limestone
- Limestone is sedimentary rock composed mainly of calcium carbonate (CaCO3).
- The most important constituents of limestone are calcite, magnesite (magnesium carbonate) and dolomite (calcium magnesium carbonate).
- The dolomitic limestone in Gujarat is used for making slabs and tiles.
- Limestone of Kalburgi district, commonly known as ‘Shahabad stones’ are used as flooring stones.
- Pulverised limestone is used as a soil conditioner to neutralise acidic soils (agricultural lime).
- 75 per cent Limestone is used in cement industry, 16 per cent in iron and steel industry and 4 per cent in the chemical industries.
- In blast furnaces, limestone (flux) binds with silica and other impurities and facilitates their removal.
- As a reagent in fuel-gas desulphurisation, it reacts with sulphur dioxide which enables air pollution control.
- It can suppress methane explosions in underground coal mines.
Distribution of Limestone in India
- Almost all the states of India produce some quantity of limestone.
| India’s Limestone Reserves in BT | India’s Production of Limestone (2017-18) in MT | |||||
| State | Reserves | State | Production | Regions | ||
|
55 | 27% |
|
75 | 22% | Almost all districts |
|
24 | 12% |
|
44 | 13% | Jabalpur, Satna, Betul |
|
24 | 12% |
|
37 | 11% | Kurnool, Guntur |
|
20 | 10% |
|
37 | 11% | Bastar, Durg, Raipur |
|
18 | 9% |
|
31 | 9% | Kalburgi, Shimoga |
| Total | 203 BT | Total | 340 MT | |||
- Exports of limestone in 2017-18 was 2.81 MT.
- Limestone in bulk was exported mainly to Bangladesh (95%) and UK (2%) on the other hand.
- Imports of limestone in 2017-18 was 20.83 MT.
- Limestone was imported mainly from UAE (78%), Oman (13%), Vietnam (4%).
- Rest of the limestone is used in paper, sugar, fertilizers, etc.
Dolomite
- Limestone with more than 10 per cent of magnesium is called dolomite.
- When the percentage rises to 45, it is true dolomite.
- Dolomite is used as blast furnace flux, as a source of magnesium salts and in fertilizer and glass industries.
- Iron and Steel industry is the chief consumer of dolomite (90 per cent) followed by fertilizer.
- Dolomite is widely distributed in the all parts of the country.
- Orissa, Chhattisgarh, Andhra Pradesh, Jharkhand, Rajasthan and Karnataka are the main producing states and contribute more than 90 per cent of the total production.
- Orissa and Chhattisgarh together account for about 57 per cent dolomite of India.
- Dolomite rock (Dolomitic Limestone) contains calcium magnesium carbonate.
- Dolomite occurrences are widespread in almost all parts of the country.
| State | Reserves | Production | Major Districts |
| Madhya Pradesh | 27% | Orissa (29%) | Sundargarh, Sambalpur and Koraput districts |
| Andhra Pradesh | 15% | Chhattisgarh (28%) | Bastar, Bilaspur, Durg and Raigarh districts |
| Chhattisgarh | 11% | Jharkhand | Singhbhum district and Palamu district |
| Odisha | 10% | Rajasthan | Ajmer, Alwar, Bhilwara, Jaipur, Jaisalmer district |
| Total | 8.4 BT | Karnataka | Belgaum, Bijapur districts |
- India exported 1.9 MT of dolomite in 2015-16.
- Exports were mainly to Nepal (86%) and Bangladesh (11%).
Magnesite
- Magnesite (MgCO3) is a carbonate of magnesium.
- The Refractory Industry is the major consumer of magnesite.
- It is primarily used for manufacturing refractory bricks.
- It is also used as a bond in abrasives, manufacture of cement for tiles and for extraction of the magnesium.
- India has 394 MT of magnesite reserves; Uttarakhand (59%), Tamil Nadu (25%) and Rajasthan (14%).
- Tamil Nadu has one of the largest deposits of magnesite in the world and the largest in India are found at Chalk Hills near Salem town.
- Tamil Nadu (69%) continued to be the major producing state followed by Uttarakhand and Karnataka.
- India imported 229 TT of magnesite in 2017-18 from China (33%), Pakistan (19%), Turkey (16%).
Other Non-Metallic Mineral Resources
Mica
- Mica is a naturally occurring non-metallic mineral that is based on a collection of silicates.
- Mica can be easily and accurately split into very thin sheets or films of any specified thickness.
- It has a unique combination of elasticity, toughness, flexibility and transparency.
- Mica is a very good insulator that has a wide range of applications in electrical and electronics industry.
- It possesses resistance to sudden change in temperature and can withstand high voltage.
| Total resources of Mica in India in MT | Total Mica Production in India in Tons | ||
| State | Reserves (2015) | State | Production 2014-15 |
| Andhra Pradesh | 41% | Andhra Pradesh (Gudur mines, Nellore) | 636 (100%) |
| Rajasthan | 21% |
|
|
| Odisha | 20% | ||
| Maharashtra | 15% | ||
| Total | 110 TT | ||
- In 2014-15, exports were mainly to China (63%), Saudi Arabia (6%).
Asbestos
- Asbestos is a group of six naturally occurring fibrous silicate minerals.
- The physical properties such as flexibility, tensile strength, high resistance to electricity, fire and corrosion by acids, make asbestos commercially important.
- Commercial asbestos is classified into two main mineralogical groups: chrysotile (serpentine) asbestos and amphibole asbestos.
- Commercially, chrysotile asbestos is far superior in physical properties.
- It is widely used for making fire-proof cloth, rope, etc.
- Asbestos cement products like sheets, pipes and tiles are used for building purposes.
- As of 2015, total reserves of asbestos in India were 23 MT.
- Rajasthan (59% – Ajmer, Udaipur, Bhilwara) and Karnataka (36% – Chikkamagaluru, Hassan, Mandya) have the highest reserves.
- Russia, China, and Brazil have 99% of the asbestos reserves.
- India’s imports of asbestos were mainly from Russia (63%), Brazil (21%) and Kazakhstan (16%).
Kyanite
- Kyanite occurs in metamorphic aluminous rocks.
- It is primarily used in metallurgical, ceramic, refractory, glass, cement industries due to its ability to stand high temperatures.
- It is also used in making sparking plugs in automobiles.
- India has the largest deposits of kyanite in the world.
- Kyanite grades depend on aluminium content. Greater the aluminium content, greater the quality.
- Jharkhand, Maharashtra and Karnataka produce practically the whole of kyanite of India.
- Jharkhand (Singhbhum district) is the largest producer of kyanite (four-fifths).
- Maharashtra (second highest producer of kyanite). Most of the reserves are in Bhandara district.
- Karnataka is the third largest producer. Commercially, workable deposits occur in Hassan district.
Sillimanite
- The occurrence and uses of sillimanite are almost the same as those of kyanite.
- The main concentration of Sillimanite is found in Tamil Nadu, Orissa, Kerala, Andhra Pradesh.
- Orissa is the largest producer of sillimanite in India. Ganjam is an important sillimanite producing district.
- Kerala is the second largest producing state.
Gypsum
- Gypsum is a hydrated sulphate of calcium.
- It is a white opaque or transparent mineral.
- It occurs in sedimentary formations such as limestones, sandstones and shales.
- It is mainly used in making ammonia sulphate fertilizer and in cement industry.
- It makes upto 4-5 per cent of cement.
- It is applied in agriculture for conserving moisture in the soil and for aiding nitrogen absorption.
- Rajasthan is by far the largest producer of gypsum in India (99 per cent of the total production of India).
- The main deposits occur in Jodhpur, Nagaur and Bikaner.
- The remaining gypsum is produced by Tamil Nadu (Tiruchirapalli district), Jammu and Kashmir.
Atomic Minerals
- Uranium, Plutonium and Thorium are the main atomic minerals.
- Other atomic minerals are beryllium, lithium and zirconium.
- Zirconium is found along the Kerala coast & in alluvial rocks of Ranchi & Hazaribagh districts of Jharkhand.
- India has sufficient reserves of beryllium to meet her requirement of atomic power generation.
- Plutonium has occurred naturally, but except for trace quantities it is now not found in the Earth’s crust.
- Plutonium is formed in nuclear power reactors from uranium-238 by neutron capture.
- The most common plutonium isotope formed in a typical nuclear reactor is the fissile Pu-239.
- Pu-239 is the principal fuel in a fast neutron reactor.
Uranium
- Uranium is a silvery-grey metallic radioactive chemical element.
- It is only naturally formed in supernova explosions.
- Uranium, thorium, and potassium are the main elements contributing to natural terrestrial radioactivity.
- Uranium has the chemical symbol U and atomic number 92.
- Uranium isotopes in natural uranium are 238U (99.27%) and 235U (0.72%).
- All uranium isotopes are radioactive and fissionable.
- But only 235U is fissile (will support a neutron-mediated chain reaction).
- Traces of Uranium are found everywhere.
- Commercial extraction is possible only in locations where the proportion of Uranium is adequate.
Uranium Reserves and Production across the World
| World’s Uranium (U) Reserves (TT) | World’s Uranium (U) Production (TT) in 2017 | ||||
| Country | Reserves as of 2015 | Country/Region | Production | ||
|
1780 | 23% |
|
23.3 | 39.2% |
|
941 | 12% |
|
13.1 | 22.1% |
|
703 | 9% |
|
5.8 | 9.9% |
|
463 | 6% |
|
4.2 | 7.1% |
| India | 139 | 2% | India | 0.4 | 0.7% |
| Total | 7641 TT | World | 59 TT | ||
- Olympic Dam and the Ranger mine in Southern Australia are important mines in Australia.
- High-grade deposits are only found in the Athabasca Basin region of Canada.
- The Chu-Sarysu basin in central Kazakhstan alone accounts for most of the country’s uranium resources
Uranium in India
- Monazite sands comprises the largest source of uranium.
- Monazite sands occur on east and west coasts and in some places in Bihar.
- But the largest concentration of monazite sand is on the Kerala coast.
- Over 15,200 tonnes of uranium is estimated to be contained in monazite.
- Some uranium is found in the copper mines of Udaipur in Rajasthan.
- Uranium deposits occur in Jaduguda in Singhbhum Thrust Belt and Hazaribagh districts of Jharkhand, Gaya district of Bihar, Cuddapah basin of Andhra Pradesh, Aravallis, & Mahadek basin of Meghalaya.
- Singhbhum Copper belt is known for a number of copper deposits with associated nickel, molybdenum, bismuth, gold, silver etc.
- The state of Andhra Pradesh is the largest producer of uranium in India.
- Tummalapalle village located in the Kadapa (Cuddapah) district of Andhra Pradesh is considered as one of the largest uranium reserves in India.
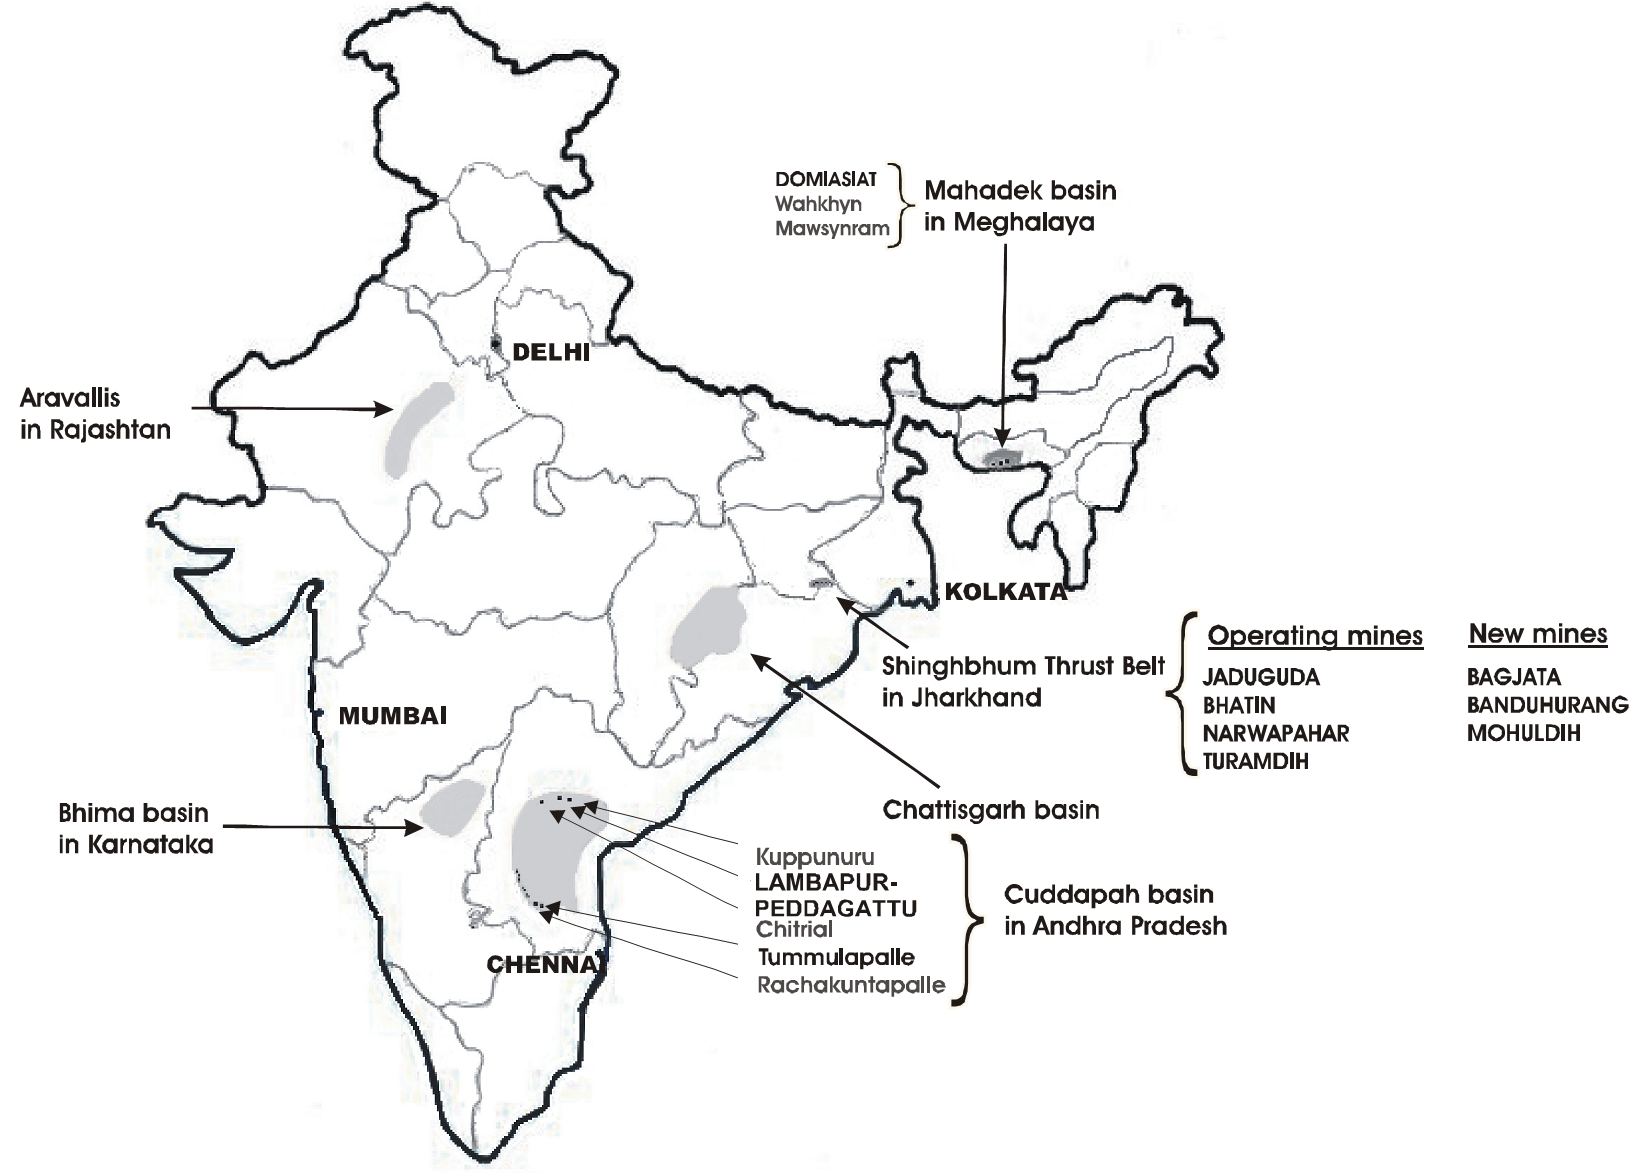

- India has no significant reserves of Uranium. All needs are met through imports.
- India imports thousands of tonnes of uranium from Russia, Kazakhstan, France, and Uzbekistan.
- India is trying hard to import uranium from Australia and Canada.
- However, there are some concerns regarding nuclear proliferation and other related issues.
Nuclear Power Plants in India
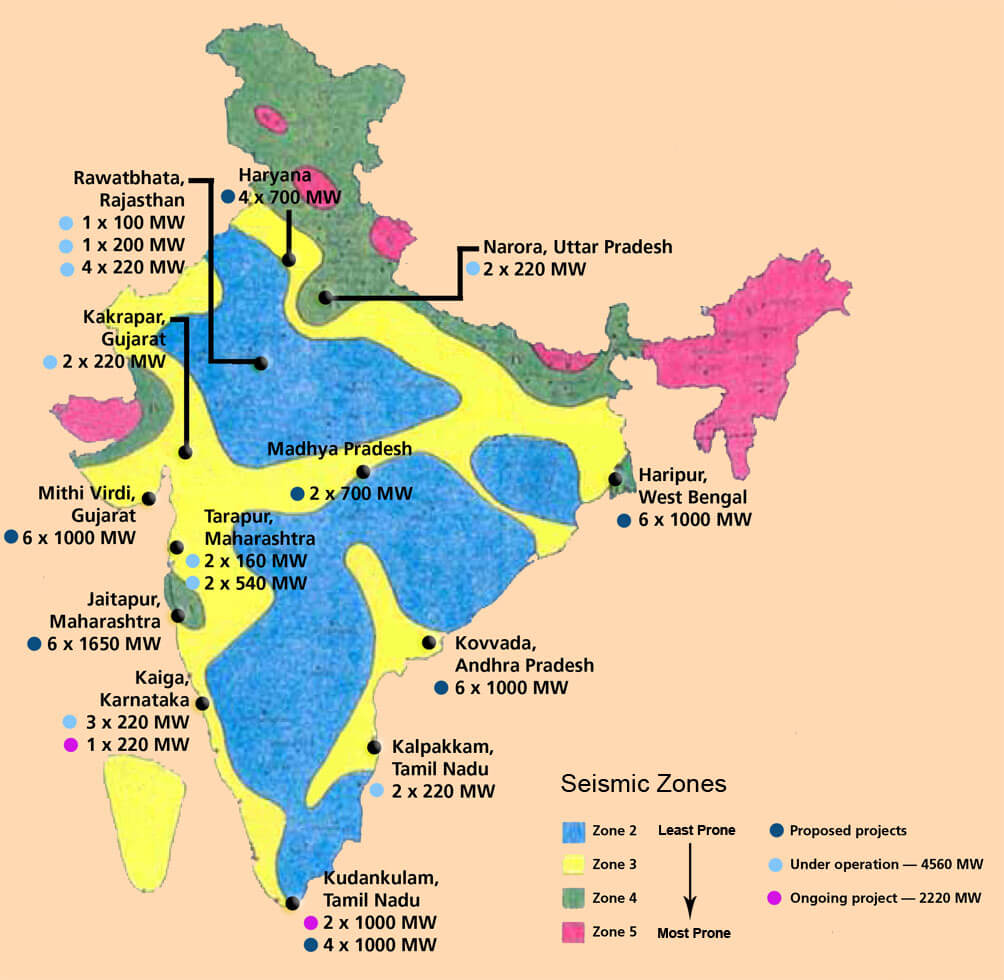

Thorium
- Thorium is a chemical element with symbol Th and atomic number 90.
- Uranium and thorium are the only radioactive elements that occur naturally in large quantities.
- Thorium is weakly radioactive: all its known isotopes are unstable, with the seven naturally occurring ones (thorium-227, 228, 229, 230, 231, 232, and 234).
- Thorium-232 is the most stable isotope of thorium and accounts for nearly all natural thorium, with the other five natural isotopes occurring only in traces.
Thorium Distribution
- Thorium is estimated to be about three to four times more abundant than uranium in the Earth’s crust and is chiefly refined from monazite sands.
- Monazite contains 2.5% thorium and is scattered along the Kerala Coast.
- The other mineral carrying thorium is thorianite.
- Thorium is predicted to be able to replace uranium as nuclear fuel in nuclear reactors, but only a few thorium reactors have yet been completed.
- The known reserves of thorium in India are estimated to be between 457,000 and 508,000 tonnes.
- Kerala, Jharkhand, Bihar, Tamil Nadu and Rajasthan are the main producers.
- United States, Australia, and India have particularly large reserves of thorium.
| World’s Thorium Reserves (2011) | India’s Thorium Reserves (2016) | 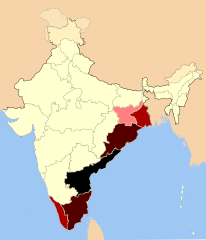 |
||
| Country | Reserves in TT | State | Reserves | |
|
963 |
|
31% | |
|
440 |
|
21% | |
|
300 |
|
20% | |
|
100 |
|
16% | |
|
35 |
|
10% | |

Related topics:
- Nuclear Fission, Components of Nuclear Reactor, Types of Nuclear Reactors
- India’s Three-Stage Nuclear Power Programme